Relevance
This chapter provides an introduction to surfactant/cosolvent flushing and reports on the current status of the technology. This is accomplished through a review of historical and ongoing field demonstrations. This chapter serves as a foundation for more rigorous considerations of hydrogeologic processes, mass removal mechanisms, step-wise implementation of field applications, and potential costs, which are presented in Chapters 3, 4, 5, and 6, respectively. After reading this chapter, the reader should have a good idea of whether surfactant/cosolvent flushing should be considered for a specific site and what results might be expected. This chapter should be read by all readers.
Key Concepts
•Surfactant/cosolvent flushing is an emerging technology that has seen no known full-scale application to date, but currently is the focus of wide-spread research and optimism.
•Field implementation of in situ surfactant/cosolvent flushing involves preparation of a chemical solution, delivery of the solution to a target, recovery of the solution and target compound(s), and management of the produced fluids.
•To date, the primary application and apparent favored niche for surfactantcosolvent flushing has been at sites contaminated by chlorinated hydrocarbon NAPLs in sand and/or gravel settings. Restoration of groundwater to typical concentration-based cleanup standards has not yet been demonstrated.
•The primary appeal of surfactant/cosolvent flushing is its potential to quickly remove a large fraction of the total NAPL mass in source zones as compared to current proven technologies.
•Historically, the primary factors that have limited field demonstrations from proceeding to full-scale applications have been concerns regarding costs and the overall benefits of partial NAPL recovery from subsurface source zones.
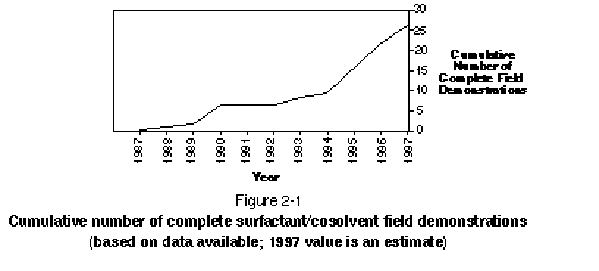
The potential to enhance the recovery of NAPLs from porous media using chemical flushing is widely recognized and has been applied in petroleum reservoirs since the mid-1920s (Beckstrom and Van Tuyl, 1927). Since the late 1970s, a growing interest has developed in the use of similar chemical systems to mitigate risk posed by subsurface NAPLs (API, 1979). This interest reflects, in large part, the ineffectiveness of currently available remedial technologies to restore NAPL zones in aquifers to typical concentration-based drinking water standards (NRC, 1994). The growing interest in surfactant/cosolvent flushing is illustrated by plotting the cumulative number of complete field trails as a function of time, as shown in Figure 2-1.

This chapter introduces surfactant/cosolvent flushing through a brief description of the technology and a review of 26 completed or ongoing field demonstrations of the technology. Information regarding these projects has been obtained from the published literature, project reports, and/or direct communications with project staff. To date, all of the identified field demonstrations have been conducted in the United States and Canada. A number of surfactant/cosolvent research projects are also ongoing in Europe, although information gathered on these efforts suggests that none have yet led to field demonstrations.
Brief summaries of the 26 field demonstrations identified here are included in Appendix A, along with a database that describes key aspects of the demonstrations. A primary challenge in compiling and comparing field demonstrations has been that the available data are of variable quantity and quality. Any inaccuracies identified through the circulation of the First Edition of this manual will be corrected in the Second Edition.
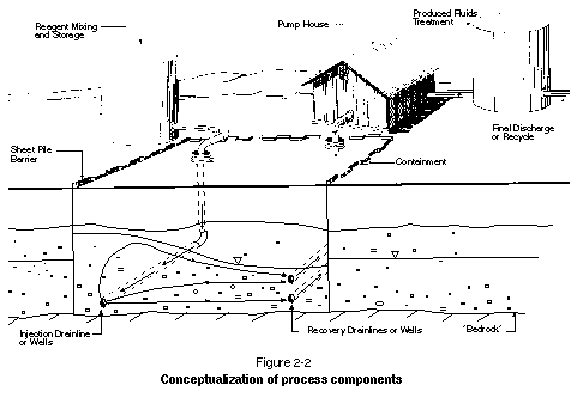
Surfactant/cosolvent flushing refers to the cycling of an injected chemical solution through zones of the subsurface contaminated by NAPL. The chemical solution is typically mixed on site and delivered and recovered using either vertical wells or horizontal drainlines. Upon contact with the NAPL, the surfactant/cosolvent solution will bring about an increase in the total aqueous solubility of the contaminants, thereby accelerating the rate of dissolution into groundwater. Depending on the particular chemical formulation, surfactants and cosolvents can also bring about physical mobilization of the NAPL. Regardless of whether the primary removal mechanism is solubilization, mobilization, or a combination of the two, fluids must be recovered from the subsurface and either treated on site or shipped off site for disposal. Methods of on-site treatment have included biological treatment, steam stripping, incineration, and air stripping. Efficient and cost-effective treatment of produced fluids is currently one of the biggest challenges facing this technology. Treatment and recycling of the surfactant or cosolvent may be key to establishing a cost effective process. The process of surfactantcosolvent flushing is conceptualized further in Figure 2-2.

The implementation of a surfactant/cosolvent flood is an aggressive method of recovering contaminants from the subsurface. The advantage of this technology compared to certain other groundwater remediation technologies is the potential to remove large amounts of NAPL in a relatively short time. However, there are risks associated with the implementation of this technology, including the potential to worsen the extent of contamination through uncontrolled vertical NAPL mobilization, the potential short-term risk of exposure due to the elevated contaminated concentrations in groundwater, and the possible need for long-term containment of unrecovered contaminants. Based on the 26 projects reviewed, restoration of groundwater to typical concentration-based cleanup standards has not yet been demonstrated using surfactant/cosolvent flushing.
To our knowledge, the general processes involved in surfactant/cosolvent flushing are not proprietary. Specific chemical agents may, however, be patented.
As of October 1996, final evaluations have been completed for 12 of the 26 field demonstrations for which there is information. The remaining 14 projects are in various phases of planning, implementation, data analysis, or reporting. Of the 26 projects, 13 have been implemented with the primary objective of testing an innovative technology with the ultimate objective of determining the efficacy of surfactant/cosolvent flushing for remediation of a specific site. The remaining 13 projects have focused on basic research regarding the effectiveness of specific approaches to surfactant/cosolvent flushing.
Based on the available information, none of the completed projects have led to plans for full-scale implementation of surfactant/cosolvent flushing. There may be other planned or implemented full-scale applications of surfactant/cosolvent flushing for which information was not readily available. Given the absence of a significant number of full-scale applications, surfactant/cosolvent flushing can be regarded as an emerging and not a proven or "off the self" technology. This distinction is important because it implies that current applications of surfactant/cosolvent flushing will likely require a significant level of site-specific testing and development.
In general, surfactant/cosolvent flushing is potentially applicable at sites with NAPL in the subsurface that will benefit from removal of the NAPL. As will be described in more detail in Chapter 3, NAPL refers to nonaqueous phase liquids, which must be distinguished from purely dissolved and sorbed contaminants. Including surfactantcosolvent flushing as part of a remedial alternative to compare to other potential technologies for cleaning a NAPL site may be desirable because other technologies have not necessarily proven effective in removing NAPL (NRC, 1994). The primary appeal of surfactant/cosolvent flushing is its potential to quickly remove a large fraction of the total NAPL mass as compared to other technologies.
In considering the applicability of surfactant/cosolvent flushing, two key aspects of a site must be considered: hydrogeologic setting and contaminant types. Table 2-1 lists the types of sites, in terms of target compounds and hydrogeologic setting, where field demonstrations of surfactant/cosolvent flushing have been attempted. As indicated in Table 2-1, porous media sand and/or gravel settings have been preferred to fractured rock, fractured clay, and low-permeability settings. This reflects the need to cycle fluids through a target zone in a reasonable period of time. The greater applicability of surfactantcosolvent flushing in sands and gravels is further supported by the generally poor results that have been achieved in sandy silts, silty clays, and fractured rock. As will be discussed in more detail throughout this manual, the hydrogeologic setting must be such that the application of surfactants or cosolvents into the subsurface is "safe" and does not create unwanted migration of contaminants.
Table 2-1 also suggests applicability of surfactant/cosolvent flushing to DNAPLs and, to a lesser extent, LNAPLs. To date, the use of surfactant/cosolvent flushing for non-NAPL targets has been limited. The greatest interest has been in the remediation of chlorinated hydrocarbons. This likely reflects a perception of greater risk and difficulty of remediation for chlorinated hydrocarbon DNAPLs.
| Table 2-1 Target Compounds and Hydrogeologic Settings of 26 Field Demonstrations |
|||
| Hydrogeologic Setting | |||
|---|---|---|---|
| Porous Media | |||
| Target Compound | Sand and/or Gravels | Sandy Silts or Silty Clays | Fractured Rock |
| DNAPLs | |||
| Creosote-Based Wood-Treating Oils | Laramie, WY (small) Laramie, WY (large) |
Fredricksburg, VA | |
| Waste Chlorinated Solvents | Hill AFB OU2, UT Mercier, Quebec Thouin, Quebec |
Commercial Site, NJ | |
| Trichloroethene | Paducah, KY Portsmith, OH Fort Worth, TX |
||
| Perchloroethene | CFB Borden, Ontario | ||
| Carbon Tetrachloride | Corpus Christi, TX | ||
| LNAPLs | |||
| Jet Fuel with Chlorinated Solvents | Hill AFB OU1, UT | ||
| Oil Cutting | Quebec City, Quebec | ||
| Transformer Oil with Polychlorinated Byphenols (PCBs) | Warren, MI | ||
| Hydraulic Oil | Hialeah County, FL | ||
| Other | |||
| Sorbed Chlorinated Solvents and Jet Fuel | Traverse City, MI Picatinny Arsenal, NJ |
||
| Sorbed (PCBs) | Westmoreland County, PA | ||
The time required to complete a surfactant/cosolvent flushing project is a function of target zone permeability, target zone heterogeneity, the number of pore volumes required, and the spacing between delivery/recovery systems. Based on projects reviewed in Appendix A, the total number of pore volumes associated with chemical flooding can range between 4 and 15. Including pre- and post-waterflood, the historical number of pore volumes ranges between 6 and 120. The effects of these and other factors on the time required to complete surfactant/cosolvent flushing are discussed in detail in Section 5.1.5. The following observations can be made regarding field pilot-test efforts completed to date:
•Systems involving injection/withdrawal well spacings of a few meters, with no pre- or post-flushing and only a few pore volumes of chemical cycling, have been completed in periods of days to weeks.
•Systems involving injection/withdrawal well spacings of a few meters, with pre- and/or post-flushing and 5 or more pore volumes of chemical cycling, have typically required months to complete.
•Systems involving large spacings (e.g., more than 3 meters), with pre- and post-flushing and multiple pore volumes of chemical cycling, have required up to a year to complete.
These time periods are relatively short compared to the time that would be required to implement a full-scale surfactant/cosolvent flood. The primary reasons for this are that a full-scale flood would likely employ wider drain and well spacings and would likely be operated for a longer period of time to achieve higher mass removal than is achieved in the majority of completed field trials. In general, however, the time required to remove a unit of contaminant mass using surfactant/cosolvent flushing is much less than with relatively passive technologies such as pump-and-treat and natural attenuation.
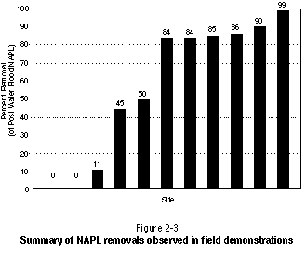
One possible objective of a surfactant/cosolvent flushing project may be NAPL mass removal. The completed field demonstrations provide some information on the range of mass removal that may be expected. Table 2-2 summarizes this information. The mass of NAPL recovered through the 16 complete projects has ranged from zero to a few grams to nearly 100,000 kg. In 11 of the instances, sufficient data were available to estimate the fraction of the initial (after water flooding) NAPL that was recovered through surfactantcosolvent flushing. These data are shown in Figure 2-3. The reported values ranged from 0 to greater than 90 percent, with an average of 58 percent. From these data, it can be concluded that under the appropriate conditions and with the appropriate chemical system, it is possible to get significant removal of NAPL (greater than 80 percent). On the other hand, the data also indicate that under inappropriate conditions and/or with inappropriate chemicals, very poor removals are possible. It is worth noting that these estimates of mass removal were developed using varying types and amounts of data. Therefore, the values are not strictly comparable or necessarily accurate.

| Table 2-2 | ||||
| Mass Removal Reported in Field Demonstrations | ||||
| Project |
Size |
Target Depth |
Reported Mass Recovered |
Reported Fraction of Initial Mass Recovered |
|---|---|---|---|---|
| Laramie, Wyoming-Small Field Demonstration | 5 m by 5 m | 2.6 m to 3.2 m bgs | Waterflood=6,200 L, Chemical Flood=1008 Liters | Waterflood 84%, Waterflood Plus Chemical Flood 95%, Fraction of Post-waterflood Residual 66% |
| Warren, Michigan | 3 m Diameter | 0 to 1.5 m bgs | 1.6 kg PCB and 16.9 kg "oil" | 11% PCB and 11% "oil" |
| Laramie, Wyoming-Large Field Demonstration | 40 m by 40 m | 2 m to 2.5 m bgs | Waterflood=291,000 L of DNAPL | Waterflood 74%, Waterflood Plus Chemical Flood 96%, Fraction of Post-waterflood Residual 84% |
| Hialeah County, Florida | 3 m by 3 m | Approximately 1.2 m bgs | Waterflood=240 L, Chemical Flood=550 Liters | 20 Percent Through Waterflood, An Additional 45% Through Chemical Flood |
| Canadian Forces Base Borden, Ontario |
3 m by 3 m | 1 m to 3.4 m bgs | Well Purging=47 L, Waterflood=2.3 L, Chemical Flood=63.43 L, Post-waterflood=3.44 L | Well Purge and Waterflood 31%, Purging, Waterflood Plus Chemical Flood 72%, Fraction of Post-waterflood Residual 40% |
| Fredricksburg, Virginia | Not Available at This Time | Not Available at This Time | Slow Injection Limited Delivery Resulting in Discontinuation of the Test | Slow Injection Limited Delivery Resulting in Discontinuation of the Test |
| Corpus Christi, Texas | 7.6 m by 11.7 m | 3.6 m to 7.3 m bgs | 283 L | No Estimates of Initial Mass Available |
| Quebec City, Quebec | Not Known at This Time | 1.8 m to 4.3 m bgs | Combined water and chemical flood 16,000 kg | Estimates of Initial Mass Available |
| Paducah, Kentucky | Approximate 2 m Radius | 20 m to 30 m bgs | No Recovery of DNAPL Achieved | 0% |
| L'Assomption, Quebec | 4.3 m by 4.3 m | 1 m to 2 m bgs | 980 kg of "DNAPL" | 86% Residual "DNAPL" in the Saturated Zone |
| Delmont Station, Pennsylvania | Fraction Approximately 150 m | 3 m to 9 m bgs | Approximately 0.32 kg of PCBs | Not Known |
| Hill AFB, Utah-Ethanol, OU1 | 3 m by 5 m | 4.6 m to 6.1 m bgs | Approximately 350 L of NAPL | >85% Cell-Wide Basis:>95% in the Central Flood Zone:>75% in Bottom 0.5 m |
| Traverse City, Michigan | 3 in Diameter | 15 m to ?? m bgs | 3.354 gm PCE Total, 2.757 gm PCE Through Surfactant-Enhanced Solubilization | Initial Mass not Known |
| Hill AFB, Utah-Surfactant with Cosolvent, OU1 Cell #8 | 3 m by 5 m | 4.9 m to 7.9 m bgs | Approximately 350 L | Preliminary Results >90% |
| Hill AFB, Utah-OU2, Micellar Flood | 6 m by 9 m (1PV=15,000 gal) |
8 m to 15 m bgs | 511 gal (By Partioning Interwell Tracer Tests) | 99 percent |
| Piketon, Ohio | 5 m by 2 m (1 PV=3,700 gal) | 9.9 m to 10.4 m bgs | 20-40 L | Approximately 50% |
| bgs=below ground surface | ||||
Endpoints for in situ remediation are often expressed in terms of soil and/or groundwater concentrations. In regard to soil concentration, the only project for which data are available is the 1989 Laramie, Wyoming project. In this case, total NAPL in the target zone after completion of waterflooding, chemical flooding, and reconditioning ranged between 200 and 11,000 mg/kg soil (with initial concentrations around 20,000 mg/kg). The range of values primarily reflects proximity to the delivery systems and the effects of preferential flow. No data have been obtained to date relative to endpoint groundwater concentrations. Further information on completed projects and results from ongoing projects should help fill the data gaps. For example, one good source of data may be Hill Air Force Base Operable Unit #1 (OU1); it is currently planned to collect groundwater samples before and after surfactant/cosolvent flushing at all 7 of the OU1 test cells where chemical flushing technologies have been tested.
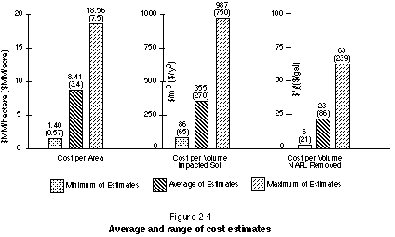
Because there is no readily available information on full-scale applications of surfactant/cosolvent flushing, no "hard" cost numbers are available and only estimates of cost can be discussed. Costs can be reported per unit volume of porous medium treated, per unit volume of NAPL recovered, and per unit area of site. When comparing costs between sites or between technologies, care should be taken to express costs on a similar basis.
The range of estimated costs that have been documented to date are presented in Figure 2-4. It should be noted that different methods were used to prepare these cost estimates, so they may not be directly comparable. In addition, the available documentation for the cost estimates did not always present the data in the units presented in Figure 2-4. Consequently, certain parameters (for example depth of contaminated media) had to be assumed and may result in significant variability. Care must be taken when evaluating these or other cost estimates. It should also be noted that all of the estimates were prepared for sites with contamination less than 15 m (49 ft) below ground surface. Further details regarding potential costs are presented in Chapter 6.
