
 |
Cost and Performance
Report:
|
Preparation of this report has been funded wholly or in part by the U.S. Environmental Protection Agency under Contract Number 68-W3-0001. It has been subject to administrative review by EPA headquarters and Regional staff and by the technology vendor. Mention of trade names for commercial products does not constitute endorsement or recommendation for use.
This report presents cost and performance data for a composting application at the Dubose Oil Products Co. Superfund site, in Cantonment, Florida. Composting was used at the Dubose site to treat soil contaminated with polynuclear aromatic hydrocarbons (PAHs), pentachlorophenol (PCP), and volatile organic compounds (VOCs), including benzene, xylene, trichloroethene (TCE), and 1,2-dichloroethene (DCE). The specific PAHs of interest at Dubose were acenaphthylene, acenaphthene, anthracene, benzo(a)anthracene, benzo(b and k)fluoranthenes, benzo(a)pyrene, benzo(ghi)perylene, chrysene, dibenz(a,h)anthracene, fluorene, fluoranthene, indeno(1,2,3)pyrene, naphthalene, phenanthrene, pyrene, and 2-methylnaphthalene.
The Dubose site is a former waste treatment, recycling, and disposal facility that operated from 1979 to 1981. Operations performed at Dubose included thermal treatment of waste oil, petroleum refining wastes, oil-based solvents, and wood treatment wastes; steam heating of spent iron and pickle liquors; and rock salt filtration of waste diesel fuel. During a remedial investigation (RI), soil at the site was found to be contaminated with PAHs (total) at concentrations ranging from 0.578 to 367 mg/kg, PCP ranging from 0.058 to 51 mg/kg, and VOCs ranging from 0.022 to 38.27 mg/kg.
A Record of Decision (ROD) was signed for this site in March 1990. The ROD specified treatment of contaminated soil using composting and identified numerical soil cleanup goals and leachate discharge standards for the site. Composting was selected instead of in situ biological treatment because it was identified as easier to control and more reliable, and because it was believed that monitoring would be easier to perform and samples would be more representative. Composting was also believed to be approximately equal in cost to in situ biological treatment. Soil cleanup goals included PAHs (total) - 50 mg/kg, PCP - 50 mg/kg, benzene - 10 mg/kg, xylenes (total) - 1.5 mg/kg, TCE - 0.05 mg/kg, and DCE - 0.07 mg/kg. Leachate discharge standards ranged from 1 to 50 µg/L for the target constituents/parameters.
The composting system used at Dubose consisted of a treatment structure, a leachate collection system, an aeration system, an inoculum growth and application system, and an on-site wastewater treatment system. Contaminated soil was treated in batches, with each batch containing from 660 to 2,310 tons of soil. For most of the batches, soil depth ranged from 4.0 to 4.25 feet. Soil was aerated to maintain a pore space oxygen content of approximately 20 percent, and inoculum was added over a period of two days (typically), until the entire surface area of the soil was moistened. A moisture content of approximately 15% and a carbon:nitrogen:phosphorus ratio of 120:10:2 was maintained during the application. Off-gasses collected by the aeration equipment were treated using granular activated carbon (GAC) adsorbers prior to discharge to the atmosphere. Composting activities were performed from May to November 1993, and site restoration activities were completed by August 1996.
Soil sampling and analysis were performed for each of 359 grids of soil treated, including analysis for PAHs (total), PCP, and specific VOCs. Additional sampling and analysis were performed for leachate contaminants, and for monitoring of contaminants in the ambient air. All soil grids met the soil cleanup goals established for Dubose. For total PAHs, before-treatment concentrations ranged from 50.8 to 576.2 mg/kg, while after-treatment concentrations ranged from 3.3 to 49.9 mg/kg (average - 19 mg/kg). For PCP, before-treatment concentrations ranged from 7.67 to 160 mg/kg, while after-treatment concentrations ranged from 16.5 to 36.3 mg/kg. The primary removal mechanism identified for PAHs in this application was bioremediation; however, volatilization was identified as the primary mechanism for removal of VOCs, either in handling or through the aeration system. In addition, PAHs and VOCs were not measured in ambient air monitors at levels greater than their levels of concern for the application.
Actual costs of $7,736,700 were reported by the PRP Steering Committee’s oversight contractor for this application, including approximately $2.5 million for before-treatment activities and $5.25 million for activities directly attributed to treatment. The $5.25 million expended for activities directly attributed to treatment corresponds to $266 per ton of soil treated (19,705 tons). This cost is relatively high because of the relatively large quantity of soil excavated (58,559 tons) but not further treated compared with the amount of soil treated. Unit costs based on the amount of soil excavated would be approximately one-third of $266, or $90 per ton of soil excavated. The application at Dubose was PRP-lead, and no information is provided in the available references on the portion of the $5.25 million cost that represents activities for excavation of less-contaminated soil that did not require further treatment in this application.
Table of Contents | Forward to Site Information
Dubose Oil Products Co. Superfund Site
Cantonment, Florida
CERCLIS # FLD000833368
Action Memorandum Date: March 29, 1990
Type of Action: Remedial
Treatability Study Associated with Application? Yes (See discussion
under remedy selection)
EPA SITE Program Test Associated with Application? No
Operating Period: November 1993 - September 1994
Quantity of Soil Treated During Application: 19,705 tons of soil [31]
Historical Activity That Generated Contamination at the Site: Waste
storage, treatment, recycling and disposal
Corresponding SIC Code: 4953 W (Waste processing facility,
miscellaneous)
Waste Management Practices That Contributed to Contamination: Waste
Treatment Plant
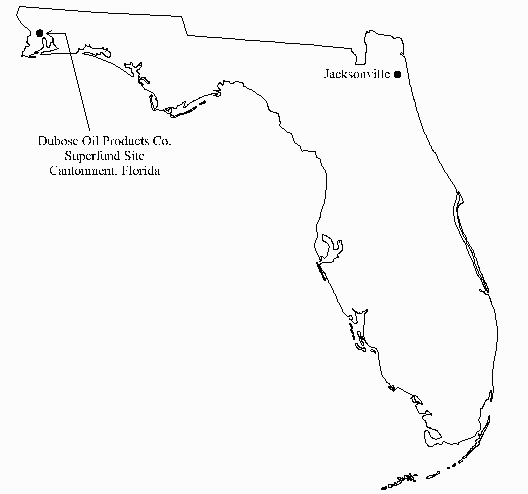
The 20-acre Dubose Oil Products Company Superfund site (Dubose, or DOPC) is a former waste storage, treatment, recycling, and disposal facility located approximately two miles west of Cantonment, Florida, as shown in Figure 1. Site operations began in 1979, and included thermal treatment of waste oil, petroleum refining wastes, oil-based solvents, and wood treatment wastes; steam heating of spent iron and steel pickle liquors; and rock salt filtration of waste diesel fuel.
Site operations ceased in 1981, and the site owner began closure of the site at that time. Closure activities included excavation of buried drums, operation of an aeration system to remediate on-site drainage ponds, and movement of contaminated material with heavy equipment. In March 1982, the Florida Department of Environmental Regulation (now called the Florida Department of Environmental Protection - FDEP) conducted an Interim Status Standards Compliance Inspection at the site. In April and May 1982, EPA and FDEP sampled the site and found buried metal objects, contaminated springs and leachate seeps, and an oil sheen on the North Pond.
In November 1984, FDEP directed an outside contractor (OH Materials Company) to excavate an on-site pond and fill it with contaminated soils and sediments. Between November 1984 and May 1985, the contractor excavated an area of the site and lined it with a 36 millimeter (mm) PVC liner. The depression was filled with site soils to approximately 20 feet above surrounding grade and covered with a 30 mil PVC cover. An estimated 38,000 cubic yards of soil was placed in the former pond area, referred to as the soil "vault". The vault was approximately 170 feet long by 170 feet wide by 35 feet deep.
In October 1987, a consent agreement was signed by FDEP and the DOPC potentially responsible party (PRP) steering committee (DOPCSC). Following the consent agreement, the PRP Steering Committee tasked a consultant (Engineering-Science) to conduct a remedial investigation/ feasibility study (RI/FS) for the site.
The RI was conducted in 1988, and revealed contamination above health-based levels in the vault soils, shallow aquifer beneath the site, on-site surface water, and sediment. The RI identified the primary contaminants of concern in the soil, groundwater, surface water, and sediment as volatile organic compounds (VOCs) including trichloroethene, benzene, toluene, and xylenes and semivolatile organic compounds including polynuclear aromatic hydrocarbons (PAHs) and phenols (e.g., pentachlorophenol, or PCP).
Regulatory Context: [1] A Record of Decision
(ROD) was signed for this site in March 1990. The ROD identified remedial
actions for this site, including:
The ROD identified numerical soil cleanup goals and leachate discharge standards for this site (see discussion under treatment system performance).
Remedy Selection: [1, 30, 31] Composting was selected as the remedy for the Dubose site from 10 alternatives. The ROD indicated that composting would be easier to control and more reliable than in situ biological treatment. In addition, the ROD indicated that monitoring the effectiveness of composting would be easier than for in situ treatment, because the mixing and turning of soil piles will make the soil more homogeneous and soil grab samples more representative. The ROD also indicated that composting would be approximately equal in cost to in situ biological treatment.
As part of the RI, Engineering Science was tasked to conduct bench-scale treatability studies on the effectiveness of biological remediation for on-site soils. Engineering Science conducted the following four types of treatability studies using contaminated soil from the containment vault: in-situ column, serum bottle, biometer, and mesocosm experiments. The mesocosm experiments showed that composting could be used to reduce the concentrations of all contaminants of concern at Dubose. [33]
Pilot-scale treatability testing was attempted six times during this project. However, soil excavated for pilot-scale tests was found to contain too low a concentration of target compounds, and no pilot-scale testing was completed.
Site Management: PRP Lead
Oversight: EPA
Remedial Project Manager: Mark Fite
U.S. EPA, Region 4
Atlanta Federal Center
100 Alabama St., S.W.
Atlanta, GA 30303
(404) 562-8927
PRP Steering Committee Oversight Contractor: Kenneth Stockwell
Parsons Engineering Science, Inc.
57 Executive Park South, N.E., Suite 500
Atlanta, GA 30329-2265
(404) 235-2351
Treatment System Vendor: David Price/Garland Long
Waste Abatement Technology, L.P. (WATEC)
1300 Williams Drive
Marietta, GA 30066
(770) 427-1947
Type of Matrix Processed Through the Treatment System: soil (ex situ)
Primary Contaminant Groups: organic compounds - volatiles, halogenated; volatiles, nonhalogenated (BTEX); semivolatiles, halogenated and semivolatiles, nonhalogenated (PAHs)
During the RI, analyses of 278 soil and sediment samples were made to determine the nature and extent of contamination in the DOPC vault. Analysis of materials in the vault indicated a general stratification of contaminants, with the highest concentration of volatile and semivolatile organic compounds present at 25-30 feet below the top of the vault. Table 1 shows the range of contaminants measured in the soil vault during the RI. In this application, total PAHs were defined as the sum of the following 17 constituents: acenaphthene, acenaphthylene, anthracene benz(a)anthracene, benzo(a)pyrene, benzo(b)fluoranthene, Benzo(g,h,i)perylene, benzo(k)fluoranthene, chrysene, dibenz(a,h)anthracene, fluoranthene, fluorene, indeno(1,2,3-cd)pyrene, naphthalene, phenanthrene, pyrene, and 2-methylnaphthalane. [31]
| VOCs | |
| Total PAHs | |
| PCP |
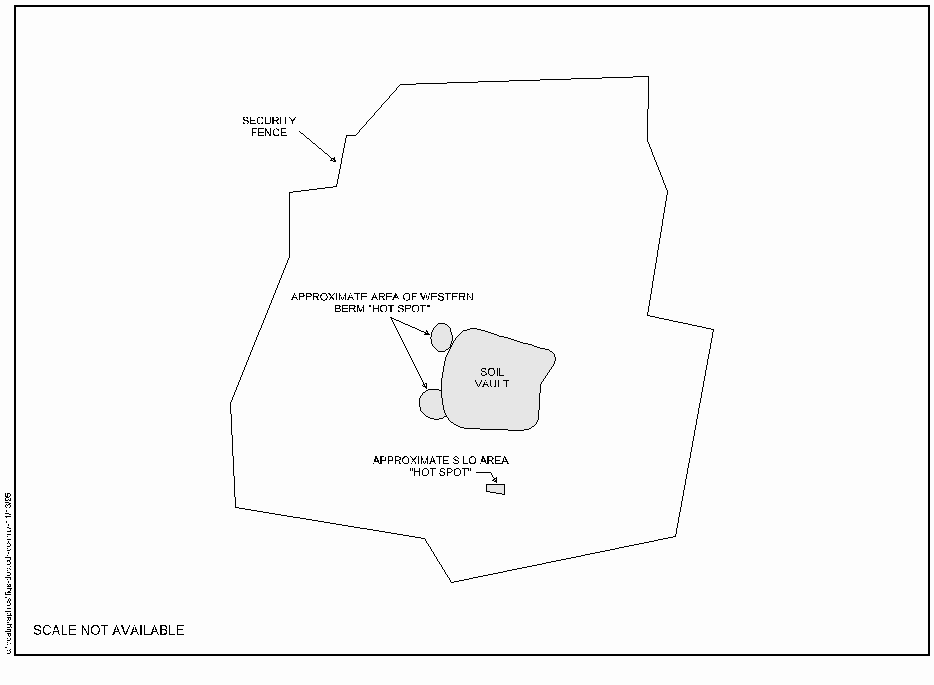
In addition, analyses of soils outside the vault were performed, and several small areas of contaminated soil were characterized, including areas in the western berm of the vault and an on-site silo. The maximum total PAH concentration measured in the soils outside the vault was 367 mg/kg. [6, 31] Figure 2 shows the location of the soil vault, western berm and silo area "hot spots" at the DOPC site.
The major matrix characteristics affecting cost or performance for this technology and the values measured for each are shown in Table 2.
| Parameter | Value | Measurement Method |
|---|---|---|
| Soil Classification | Not provided | - |
| Clay Content and/or Particle Size Distribution | ||
| pH | ||
| Total Petroleum Hydrocarbons | ||
| Moisture Content |
N/A - Measurement method not reported for this parameter because resulting value not expected to vary among measurement methods.
Although detailed soil classifications and particle size distribution information is not provided in the available references, the RPM indicated the soil was a Lakeland loamy sand. [32]
Composting
Post-treatment (air) - carbon adsorption; post-treatment (water) - chemical, filtration
The composting system used at DOPC consisted of a treatment structure, a leachate collection system, an aeration system, an inoculum growth and application system, and an on-site wastewater treatment system. Soil was piled approximately 4.0 to 4.25 feet deep in the treatment structure, and ambient air was drawn downward through the soil pile. A soil oxygen content of approximately 20% was maintained for this application. The inoculum solution was prepared using native soil microbes, and sprayed over the soil pile using a fire hose. Soil moisture was maintained at approximately 15%.
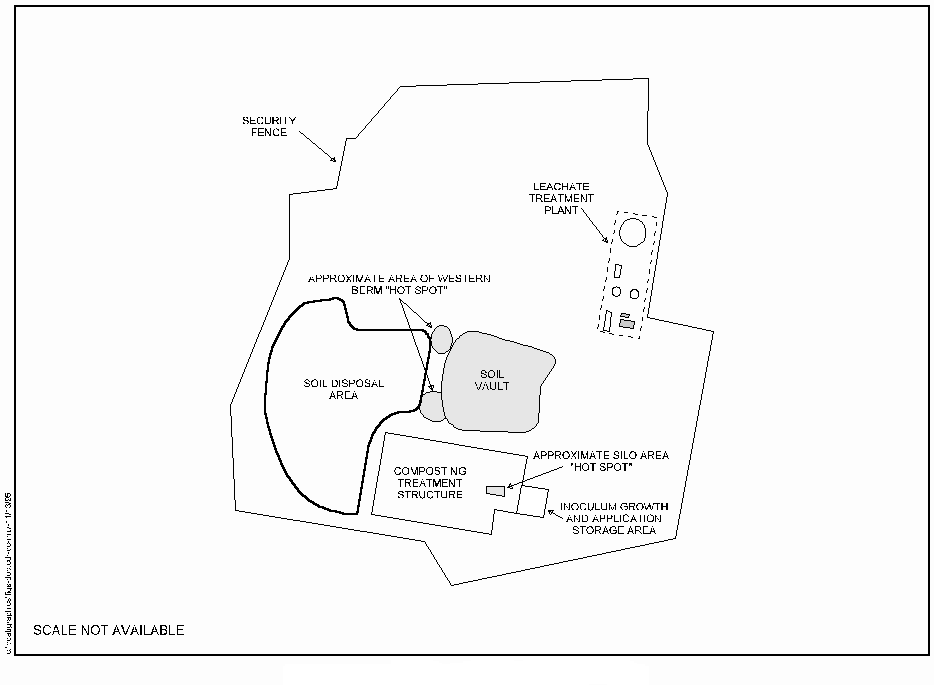
Figure 3 shows the layout of the major equipment at the site, including the location of the soil disposal area.
System Design
Treatment Structure [17]
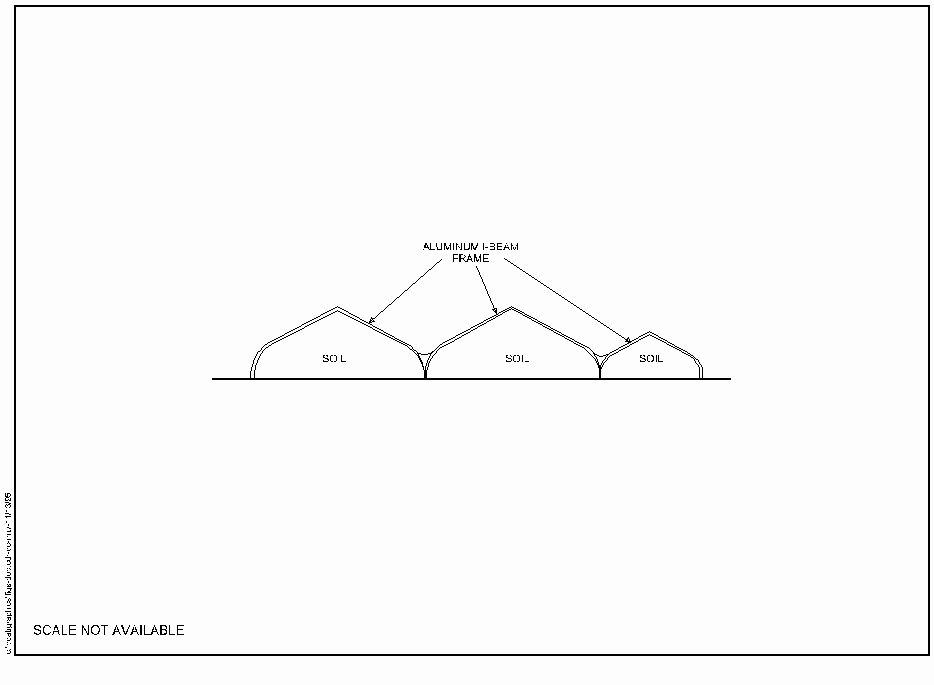
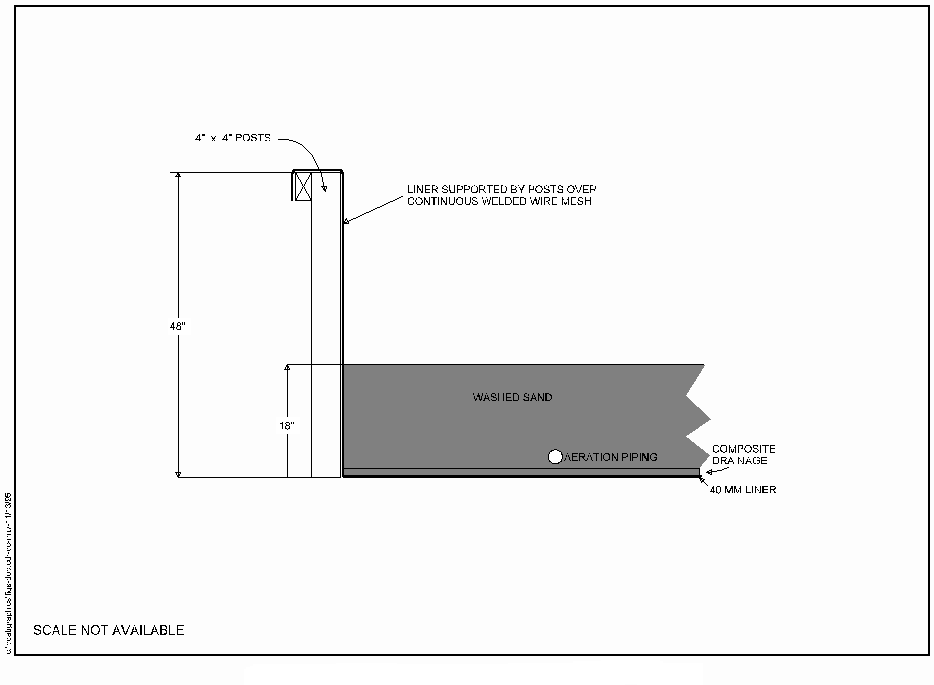
The treatment structure used at DOPC was a 33,000 square foot modular pre-engineered building (approximately 220 by 150 feet) that included three separate units (bays) positioned side by side. The structure was an aluminum I-beam frame structure with reinforced PVC fabric tensioned between the beams. Figure 4 shows a side view of the treatment structure. This structure was leased from Sprung Instant Structures of Fontana, California.
The floor of the structure was covered with a continuous 40 mm low density polyethylene (LDPE) liner which was anchored on top of a continuous 4 foot high wall around the facility. The wall inside of the structure was made of pressure treated lumber reinforced with welded wire mesh.
Leachate Collection System [17]
A leachate collection system was used to collect leachate generated from rainwater which blew in from the sides of the open end structure, from excess inoculum mixture which leached out of the soil, and from excess water draining from wet soil placed in the treatment structure.
The treatment structure was designed to incline east at a slope of 1%, and north at a slope of 1%, such that leachate would collect at the northeast corner of the structure. To assist in leachate collection, a composite drainage material was installed on top of the LDPE liner, consisting of a high density polyethylene (HDPE) capillary grid with a continuous 6 ounce non-woven geotextile attached to both sides. The geotextile acted as a fabric filter to keep solids out of the capillary grid. Eighteen (18) inches of filter sand were placed on top of the composite drainage materials to protect the liner and help leachate to drain to the collection system.
At the north end of the facility, a 2 foot deep by 2 foot wide leachate collection trench was installed. This trench was filled with number 68 stone, and transported leachate by gravity along the slope to the east end of the facility. Leachate was discharged from the trench to a concrete sump, located outside of the structure, and from there pumped to an on-site wastewater treatment system.
The aeration system used at DOPC, shown in Figure 5, pulled air through the soil placed inside the treatment structure, and consisted of pipes and valves, a moisture separator, a blower unit, and two vapor phase carbon vessels. This system also extracted VOCs from the soil.
Approximately 3,000 feet of aeration piping were installed throughout the treatment structure on top of the composite drainage mat, and below the 18 inches of filter sand, as shown in Figure 6. The pipes were 4-inch diameter perforated 3034 PVC wrapped in polyester pipe sock, and spaced approximately 10 inches apart.
The blower unit used at DOPC was a 15 horsepower Rotron EN12 explosion proof regenerative blower, which pulled approximately 300 cubic feet per minute (cfm) of air at a vacuum at 80 to 90 inches of water.
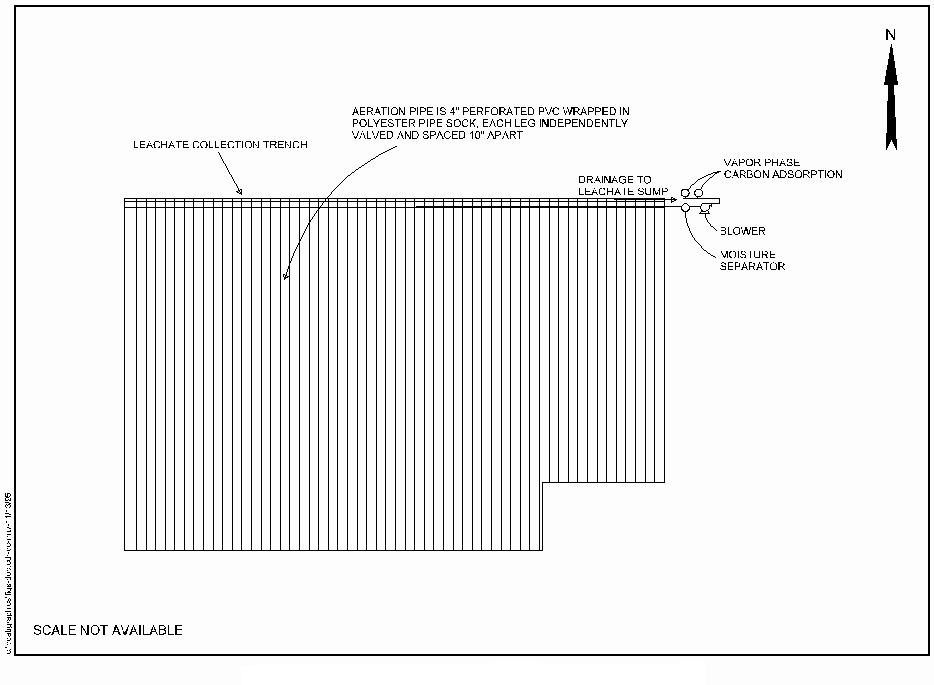
The VOC-containing air discharged from the blower passed through two Carbtrol W-2 vapor phase carbon adsorbers plumbed in parallel. Each of these units contained 300 pounds of granular activated carbon (GAC) and were designed to treat a maximum air flow of 250 cfm. According to WATEC, a total of 1,800 pounds of GAC were used in this application. VOCs in the carbon exhaust were monitored daily, and carbon switchouts were made as appropriate to avoid VOC breakthrough. WATEC reported that they had given consideration to recirculating air from the carbon exhaust to the soil stockpile, but decided that the system was performing adequately without doing so and therefore they chose to not perform recirculation.
Inoculum Growth and Application System [17, 18]
The inoculum growth and application system consisted of two inoculum growth tanks, an inoculum mixing tank, and a pump and fire hose for dispensing the mixture. A schematic of this system is shown in Figure 7. Two 2,000-gallon polyethylene tanks were used to grow the inoculum, using indigenous site soil, water, nutrients, and air. Indigenous site soil was found to contain sufficient microbial activity to support the composting process. Inoculum was allowed to grow for at least 7 days before use in the treatment structure.
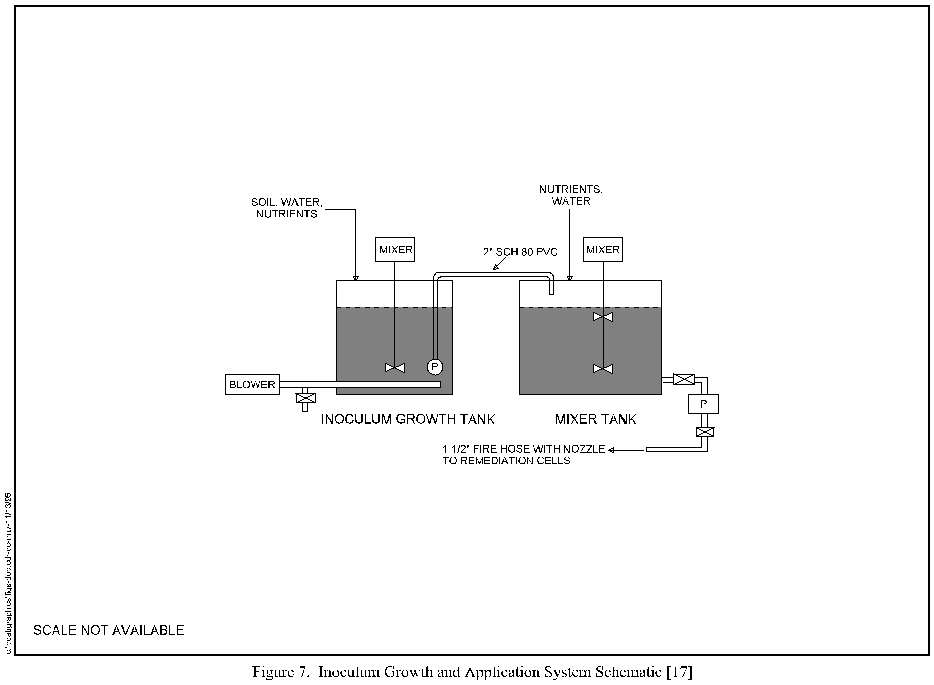
The inoculum mixing tank was a 5,000-gallon polyethylene tank equipped with a Lightnin Vector 1-1/2 horsepower high speed mixer operated at 750 rpm. A portion of the inoculum from the growth tank was mixed with additional nutrients and water in this tank. The inoculum mixture was pumped from the mixing tank using a Pulsafeeder centrifugal pump and a firehose and nozzle at 20 gallons per minute.
It was anticipated that a cometabolite (molasses) would need to be added to the mixture in this tank to support the microbial population, however, this proved unnecessary. The treatment vendor identified several possible reasons for this, including higher than expected soil TPH concentrations, and smaller than expected concentrations of high ring contaminants and PCP.
On-Site Wastewater Treatment System [31]
The on-site wastewater treatment system consisted of the following
components:
System Operation [31]
Each of the three bays in the treatment structure was used as a treatment cell, and soil was treated in each cell on a batch basis. A batch of soil contained between 660 and 2,310 tons of soil, depending upon the size of the bay and the depth of the soil being treated. For most of the batches, soil depth ranged from 4.0 to 4.25 feet.
Soil from the vault or other hot spots was transported to the treatment cells and spread in the cell. The soil in the cell was then marked into 165 cubic yard grids. Each grid was sampled and analyzed for VOCs, PCP, and PAHs. Grids that contained VOCs, PCP, or PAHs at concentrations greater than the soil cleanup goals (see discussion under cleanup goals and standards) were left in the treatment cell. Soil in grids that did not exceed any of the cleanup goals was removed from the cell and transported to the soil disposal area, as shown in Figure 3. Soil was moved in and out of the facility with a 2-1/2 or 4-1/2 yard rubber tire front end loader.
Of the 58,559 tons of soil excavated at the DOPC site, 19,705 tons were treated using the composting system. The other 38,854 tons of soil excavated met the soil cleanup standards and did not require treatment.
Aeration of the soil was accomplished using an aeration system sized to introduce a soil pore volume once every 90 minutes, and to maintain a pore space oxygen content of approximately 20 percent. Air flow rate was maintained at between 250 and 300 cfm for the application.
Inoculation of the soil was performed by adding the inoculum mixture to the soil relatively slowly, at about 20 gallons per minute and continued until the entire surface area of the cell was moistened. Generally, a batch was inoculated over a period of two days to provide time for the water to soak into the soil, while minimizing surface puddling or runoff. A soil moisture content of approximately 15% and a carbon:nitrogen:phosphorus ratio of 120:10:2 was maintained during this application.
Leachate collected from the soil was treated in the on-site wastewater treatment system to remove excess nutrients and other contaminants.
Early in the project, the treatment vendor was concerned that simply applying the inoculum mixture to the top of the soil mass with a fire hose may not allow for adequate diffusion of soil moisture to the bottom of the soil mass. To address this concern, they conducted a field pilot test of the soil moisture in a batch at various depths before and after application. The test showed that after 24 hours, soil moisture was relatively homogenous (plus or minus 2 percent) throughout the soil mass, and that there was adequate diffusion of moisture throughout the soil mass.
Disposition of Treated Soil [31]
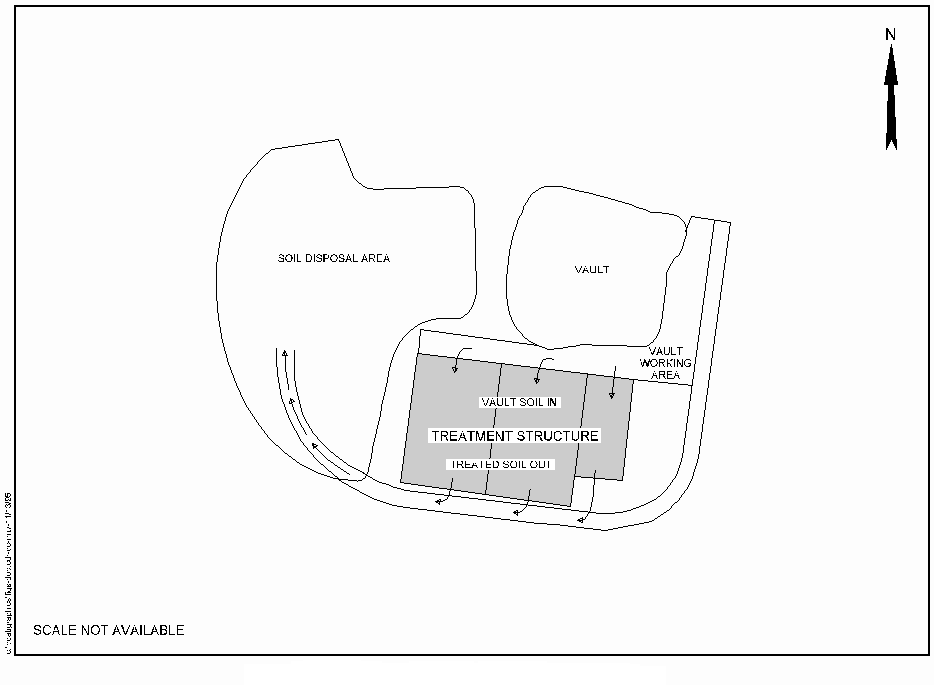
According to the PRP steering committee oversight contractor, the composting system treated all soil batches to the cleanup levels within 14 to 30 days. In addition, the contractor stated that 88% of the soil was treated to meet the cleanup goals within 14 days; however, no data supporting this percentage are provided in the available references. As shown in Figure 8, contaminated soil was transported from the soil vault or other hot spot to the treatment structure. Treated soil was then transported to an on-site soil disposal area.
System Shutdown
After all soil piles were treated to meet the cleanup standards, the treated soil was sampled and excavated, piping and liner materials were removed, and the soil beneath the liner was sampled to verify that contaminants had not migrated beneath the liner. The excavation was then backfilled with treated soils (which had been stored in the ravine area at the site) to above grade, and a limited quantity of topsoil was placed on top of the excavation. The site was graded, erosion control measures were installed, and vegetation was applied. The ROD had required Dubose to apply two feet of topsoil over all the excavation, however, the actual quantity of topsoil applied was less than two feet. It is not known if this difference in topsoil quantity had any affect on vegetation growth. No information was provided in the available references on why the actual quantity used differed from the ROD specification.
Health and Safety [32]
All work at the site was performed using Level B personal protective equipment (e.g., supplied air respiration). The vendor monitored work zone and breathing zone ambient air contaminants throughout the remediation, and reportedly never identified any elevated concentrations that would have required them to implement their contingency plan.
The major operating parameters affecting cost or performance for this technology and the values measured for each are shown in Table 3.
| Air Flow Rate | ||
| Mixing Rate/Frequency | ||
| Moisture Content | ||
| pH | ||
| Residence Time | ||
| Temperature | ||
| Oxygen Uptake Rate | ||
| Hydrocarbon Degradation | ||
| Nutrients and Other Soil Amendments | ||
| Soil Loading Rate | ||
| Soil Oxygen Content |
N/A - Measurement method not reported for this parameter because resulting value not expected to vary among measurement methods.
A timeline for this application is shown in Table 4.
| Waste storage, treatment, recycling, and disposal facility operated by DOPC | ||
| EPA and FDEP inspect and sample site | ||
| Contaminated soil excavated and placed in on-site vault | ||
| DOPC listed on NPL | ||
| Consent agreement reached by FDEP and DOPCSC | ||
| Remedial investigation performed | ||
| ROD signed | ||
| Site preparation activities performed | ||
| Soil vault excavation and treatment activities performed | ||
| Site restoration and remediation facilities demolition performed | ||
| Final site inspection performed. | ||
| Final Remedial Action Report issued (approved February 1997) |
The ROD identified soil cleanup goals and leachate discharge cleanup standards for total PAHs, PCP, total xylenes, benzene, TCE, and DCE, as shown in Table 5. [1]
Constituent/Parameter |
(mg/kg) |
|
|---|---|---|
| Total Polynuclear Aromatic Hydrocarbons (PAHs) | ||
| Pentachlorophenol (PCP) | ||
| Total Xylenes | ||
| Benzene | ||
| Trichloroethene (TCE) | ||
| 1,1-Dichloroethene (DCE) |
Cleanup goals for constituents/parameters in the soil were based on either
leaching potential or health-based criteria, as follows [1]:
As discussed under treatment system description, soil placed in the treatment cells was divided into grids, then analyzed to determine if the grid contained levels of constituents of concern above the cleanup goals. Only soil in grids where the contaminants exceeded the cleanup goals was treated. Treatment performance data consist of soil samples for 286 grids of soil from the soil vault, 68 grids of soil from the west berm, and 5 grids of soil from the silo (359 grids total), and air emission samples at and near the perimeter of the site.
A total of 359 grid samples were analyzed for benzene, DCE, TCE, total xylenes, PCP, and total PAHs. Of the 359 grids, 56 (16%) contained total PAHs at concentrations greater than the cleanup goal (50 mg/kg) and 102 contained VOCs, primarily xylenes, in excess of the VOC cleanup goals. The 56 grids exceeding the total PAH cleanup goal contained 8,783 tons of soil. Table 6 shows the grid number and contaminant concentrations before- and after-treatment for the 56 grids that exceeded the total PAH cleanup goal. The 102 grids exceeding the cleanup goal for VOCs contained 10,922 tons of soil. Thus, 19,705 tons of soil (8,783 tons for PAHs and 10,922 tons for VOCs) required treatment.
*This table shows analytical results only for the 56 of 359 grids that contained total PAHs at concentrations exceeding the cleanup goal (50 mg/kg). UVS means upper vault samples and LVS means lower vault samples. Where no data are shown (blanks in table), analytical result was below detection limit.
The treatment vendor calculated the average concentrations for 17 PAHs measured in grids 101 through 221 before-treatment and after 14 days of treatment. The average concentrations for these constituents in grids that required treatment are shown in Table 7. In addition, for grids 101 through 221, which consisted of approximately 20,000 cubic yards of soil, the treatment vendor estimated that 9,900 cubic yards (50%) required treatment, including 2,970 cubic yards (15%) for total PAHs and 6,930 cubic yards (35%) for VOCs.
The treatment vendor indicated that, while the primary removal mechanism for PAHs was bioremediation, the primary removal mechanism for VOCs was volatilization, either in handling or through the aeration system. Before- and after-treatment data for the 102 grids exceeding the cleanup goal for VOCs are not presented in this report because the vendor believes these constituents were removed through volatilization rather than bioremediation.
According to the RPM, the soil was handled at least twice before undergoing composting, and there may have been some limited amount of fugitive losses during such handling. However, no data were collected to evaluate potential fugitive losses. In addition, work zone and breathing zone ambient air monitoring data for VOCs was collected throughout the remediation. These data never triggered the requirement to implement a contingency plan which would have had to be implemented if elevated concentrations were identified. The only contaminants measured in the ambient monitoring system were phenanthrene and naphthalene, and these contaminants were measured at concentrations less than their contingency levels. During aeration, all VOCs extracted from the soil were treated using the GAC system prior to release to the atmosphere.
Air Emission Samples [31]
Air emission samples were collected at four air monitoring stations, each consisting of a volatile organic sampler (Xontech sampler) and a semi-volatile sampler (PS-1). Air monitoring was planned as a contingency measure in the event of a release or suspected release of airborne contaminants, and for monthly documentation during soil excavation/ transport activities.
No contingency monitoring was required by events occurring during the project. Monthly monitoring was performed over nine 24-hour periods when contaminated soil excavation/transport activities were underway.
According to the DOPCSC oversight contractor, analytical results of the air emission samples indicated all contaminants of concern were present at levels below levels of concern. These data are not provided in the available references, but are available in the detailed files for the project. [34]
Table 7. Soil Treatment Results for Individual PAHs [18]1
| Constituent |
Average Concentration in Soil Before Treatment (mg/kg) |
Average Concentration in Soil After 14 Days of Treatment (mg/kg) |
|---|---|---|
| Two-Ring PAHs |
||
| Naphthalene | 1.48 |
BDL |
| 2-Methyl Naphthalene | 1.11 |
0.26 |
| Acenaphthylene | BDL |
BDL |
| Acenaphthene | 4.15 |
0.74 |
| Three-Ring PAHs |
||
| Fluorene | 5.2 |
0.89 |
| Phenanthrene | 16.5 |
3.6 |
| Anthracene | 26.4 |
7.94 |
| Four- and Five-Ring PAHs |
||
| Fluoranthene | 9.56 |
5.28 |
| Pyrene | 5.52 |
4.35 |
| Benzo(a)anthracene | BDL |
BDL |
| Chrysene | BDL |
BDL |
| Benzo(b)fluoranthene | BDL |
BDL |
| Benzo(k)fluoranthene | BDL |
BDL |
| Benzo(a)pyrene | BDL |
BDL |
| Indeno(1,2,3-cd)pyrene | BDL |
BDL |
| Dibenz(a,h)anthracene | BDL |
BDL |
| Benzo(g,h,i)perylene | BDL |
BDL |
1This table shows average concentrations for only those grids
within grid numbers 101 through 221 that required treatment for PAHs.
BDL - Below Detection Limit.
As discussed under treatment performance data, 56 of the 359 soil grids excavated at the DOPC site (corresponding to 8,763 of 58,559 tons of soil) required treatment for total PAHs. The analytical data for these soil grids summarized in Table 6 show that before-treatment concentrations of total PAHs ranged from 50.8 mg/kg to 576.2 mg/kg, with 21 of the 56 grids containing total PAHs at concentrations more than twice the soil cleanup goal for total PAHs (50 mg/kg). The after-treatment concentration data shown in Table 6 indicate that all 56 grids met the soil cleanup goals for total PAHs, PCP, total xylenes, benzene, TCE, and DCE. Total PAHs in the 56 treated soil grids ranged from 3.3 mg/kg to 49.9 mg/kg, and the average concentration of total PAHs in the treated soil was 19 mg/kg.
In addition, for these 56 soil grid samples, PCP before-treatment concentrations ranged from 7.67 mg/kg to 160 mg/kg, and after-treatment concentrations ranged from 16.5 mg/kg to 36.3 mg/kg; total xylenes before-treatment concentrations ranged from 0.07 mg/kg to 69.5 mg/kg, and after treatment concentrations from 0.03 mg/kg to 1.05 mg/kg; and TCE before-treatment concentrations ranged from 0.01 mg/kg to 1.0 mg/kg, and after treatment concentrations from 0.01 mg/kg to 0.04 mg/kg. Benzene and DCE were not measured at concentrations greater than their soil cleanup goals in these 56 grids.
Analytical data for individual PAHs shown in Table 7 indicate that the majority of PAHs measured at detectable concentrations in the soil in grid numbers 101 through 221 before treatment were two- and three-ring constituents. Six of the seven two- and three-ring PAHs shown in Table 7 had detectable concentrations before treatment, averaging up to 26.4 mg/kg for anthracene (a three-ring PAH), while only two of the ten four- and five-ring PAHs had detectable concentrations. Also as shown in Table 7, two- and three-ring PAHs showed approximately 80% reduction in average concentration after 14 days of treatment for these grids, while four- and five-ring PAHs showed less than 50% reduction in average concentration over the same time period.
Before- and after-treatment data for the 102 grids exceeding the cleanup goal for VOCs are not presented in this report because the vendor believes these constituents were removed through volatilization rather than bioremediation.
Treatment performance data are available to characterize the before- and after-treatment concentrations for total PAHs, PCP, total xylenes, benzene, TCE, and DCE in the soil excavated at the DOPC site; and the range of operating parameters monitored in this application. In addition, the PRP steering committee oversight contractor reported that air emission monthly monitoring samples are available for nine 24-hour periods during excavation/transport activities. No data are available to link specific operating parameters with treatment performance data for individual batches (e.g., residence time, application of inoculum).
The treatment vendor performed extensive quality assurance/quality control
(QA/QC) procedures as part of this remedial activity. QA/QC procedures included
development of a Quality Assurance Project Plan (QAPP - Ref. 12), use of
standard EPA analytical procedures, such as SW-846 Method 8270 for PAHs and PCP
and 8010/8020 for VOCs, and use of trip blanks, field duplicates, matrix
spikes, and matrix spike duplicates. No exceptions to the QA/QC procedures were
noted by the vendor for this treatment application. [31]
The PRP Steering Committee selected WATEC as the remedial action treatment vendor and Parsons Engineering Science, Inc. as the oversight contractor. WATEC designed, constructed, and operated the composting process at the DOPC site, and Parsons performed oversight activities, including sample collection and analysis, and preparation of a remedial action report.
No information is provided in the available references on the competitive nature of the two procurements; how many bids were provided for each function; or what was the basis for contractor selection.
Actual costs of $7,736,700 were reported by the PRP steering committee's oversight contractor for this application, as shown in Table 8. Table 8 shows the specific activity and corresponding cost as reported by the oversight contractor.
Table 8. Costs Reported by PRP Steering Committee [31]
| Activity |
Actual Cost ($) |
|---|---|
| Oversight by PRP Group Remedial design |
17,500 |
| RI/FS North pond effluent Vault and north pond dike Air monitoring Groundwater and surface water monitoring |
940,000 |
| Site security fencing Vault cover replacement Repair of north pond dike Miscellaneous (accounting, hog barn demolition, entrance road construction, tire disposal) |
9,300 |
| O&M of leachate treatment | 42,500 |
| Drums/Tanks/Structures/Miscellaneous Demolition and Removal | 26,000 |
| Remedial action/construction DOPCSC remedial action oversight |
4,780,000 |
| TOTAL | 7,736,700 |
The costs for specific activities shown in Table 8 represent actual costs for those activities as reported by the PRP steering committee oversight contractor. No information was contained in the available references on the components of these specific activities, or the costs for those components (e.g., for the $4.78 million expended on remedial action/construction).
WATEC reported that a performance-based specification would be better suited
for these types of projects. They reported that the design package on which
they bid was not subsequently implemented, and that such changes would be
accommodated more easily with a performance-based specification. [32]
This case study was prepared for the U.S. Environmental Protection Agency's Office of Solid Waste and Emergency Response, Technology Innovation Office. Assistance was provided by Radian International under EPA Contract No. 68-W3-0001 and U.S. Army Corps of Engineers Contract No. DACA45-96-D-0016.