
|
Cost and Performance
Report:
|
Preparation of this report has been funded wholly or in part by the U.S. Environmental Protection Agency under Contract Number 68-W3-0001. It has been subject to administrative review by EPA headquarters and Regional staff and by the technology vendor. Mention of trade names for commercial products does not constitute endorsement or recommendation for use.
This report presents cost and performance data for a land treatment application at the Burlington Northern Superfund site, in Brainerd/Baxter, Minnesota. Land treatment was used at the Burlington Northern site to treat soil and sludge contaminated with polynuclear aromatic hydrocarbons (PAHs) and other non-halogenated semivolatile organic compounds, including naphthalene, acenaphthylene, acenapthene, fluorene, phenanthrene, anthracene, fluoranthene, pyrene, benzo(a)anthracene, chrysene, benzo(b and k)fluoranthenes, benzo(a)pyrene, benzo(ghi)perylene, dibenzo(a,h)anthracene, indeno(1,2,3)pyrene, and phenols.
The Burlington Northern site was the location of a railroad tie treating plant that operated from 1907 to 1985. Wood preserving processes operated at the site involved pressure treatment using a heated creosote/coal tar or creosote/fuel oil mixture. Wastewater generated from the wood preserving processes was discharged to two shallow, unlined surface impoundments for disposal. In the 1980’s, EPA determined that soil beneath these two surface impoundments, as well as soil in three other areas at the site (the process, drip track, and black dock areas) were contaminated. Total PAH concentrations for visibly-contaminated soils in the surface impoundments were measured as high as 70,633 mg/kg, with individual PAHs measured as high as 21,319 mg/kg (acenaphthene, a two-ring PAH), 7,902 mg/kg (phenanthrene, a three-ring PAH), and 10,053 mg/kg (fluoranthene, a four-ring PAH). Concentrations of benzene-extractable constituents in the surface impoundment soils ranged from 66,100 to 112,500 mg/kg.
In April, 1985, a three-party consent agreement for this site was signed by Burlington Northern, the Minnesota Pollution Control Agency (MPCA), and EPA. Based on the consent agreement, EPA issued an Enforcement Decision Document (a predecessor to a ROD) in June 1986, which required Burlington Northern to treat visibly-contaminated soils and sludges using on-site land treatment. In addition, a RCRA Part B permit was issued for this site which specified that the concentration of methylene chloride extractable (MCE) hydrocarbons (a replacement for benzene extractables) and total PAHs (the sum of 17 specific PAHs) in the treatment zone would not be greater than 21,000 mg/kg and 8,632 mg/kg, respectively. While the permit also specified that the treatment zone would be detoxified to “within Microtox® limits,” no quantitative limits were provided in the permit.
The land treatment unit (LTU) used in this application was constructed at Burlington Northern in 1985, with outer dimensions of approximately 300 by 495 feet (150,000 ft2) and an area available for treatment of approximately 255 by 450 feet (115,000 ft2). The LTU was constructed in layers, over a base of 100 mm thick HDPE, silty sand ballast, gravel, and clean, silty sand. Two-foot wide leachate collection drains were installed in the gravel layer, on 100-foot centers. Each year from 1986 through 1994 (nine years total), between 1,100 and 1,500 cubic yards of contaminated soil and sludge were spread over the LTU to a depth of 6-8 inches. Land treatment was conducted from May through October (the “treatment season”), and included weekly cultivation, irrigation, lime addition, and cow manure application. In July and August, 1995, after completion of LTU operation, Burlington Northern placed a cover over the LTU.
Soil sampling and analysis were performed at the beginning and end of each of the nine treatment seasons, and again throughout the depth of the LTU at the completion of treatment. The yearly analytical data indicate that the average concentrations for MCE hydrocarbons was reduced from 64,000 to 33,000 mg/kg, and for total PAHs from 9,733 to 1,854 mg/kg, over the nine treatment seasons. The analytical data from the LTU at the completion of treatment indicate that MCE hydrocarbons ranged from 24,800 to 26,900 mg/kg, and total PAHs from 608 to 795 mg/kg, throughout the depth of the treated soil and sludge. In addition, at the completion of treatment, Microtox® EC 50 testing (5 minute, 15 °C) showed residual toxicity ranging from 4.9 to 15.3. As shown by these data, the LTU met the cleanup goal for total PAHs, but did not meet the cleanup goal for MCE hydrocarbons. According to the Remedial Action Report, the soil was not treated to “within Microtox® limits”; however, as stated previously, these limits were not provided in the available information. In addition, the total PAH cleanup requirement was met for all nine treatment seasons. Because the LTU did not meet the cleanup requirements for MCE hydrocarbons or toxicity, Burlington Northern was required to implement a contingency procedure in their permit and place a cover over the LTU.
The land treatment application at Burlington Northern was PRP-lead, and no information on actual costs incurred (before-treatment, treatment, or after-treatment, as appropriate) is provided in the available references. In addition, no information is provided on unit costs (e.g., costs per cubic yard of soil and sludge treated) for this application.
Table of Contents |
Forward to Site Information
Burlington Northern Superfund site
Brainerd/Baxter, Minnesota
CERCLIS # MND000686196
Enforcement Decision Document Date: June 4, 1986
Type of Action: Remedial
Treatability Study Associated with Application? Yes (refer to Reference
15 for additional information)
EPA SITE Program Test Associated with Application? Yes
A SITE program test of slurry phase biological treatment was conducted on a
pilot-scale basis in 1991 using contaminated soil from Burlington Northern.
Reference 20 contains additional information on the SITE program test.
Operating Period: May 1986 - October 1994
Quantity of Soil Treated During Application: 13,000 cubic yards of soil
and sludge
This quantity consists of 8,500 cubic yards of soil and sludge excavated from
two surface impoundments, 3,500 cubic yards of soil excavated from other areas
of interest at the site (process area, drip track area, and black dock area),
and 1,000 cubic yards of sand, gravel, and other soil from stockpile closure
activities. [1]
Historical Activity That Contributed to Contamination at the Site:
Creosote wood preserving
Corresponding SIC Code: 2491B (Wood Preserving Using Creosote)
Waste Management Practices That Contributed to Contamination:
Manufacturing Process, Surface Impoundments
Site History: The Burlington Northern Superfund site (Burlington Northern) is located partly in Baxter and partly in Brainerd, Minnesota, as shown in Figure 1. Burlington Northern Railroad operated a railroad tie treating plant at the site between 1907 and 1985. The wood preserving process used at the site involved pressure treatment using a heated creosote/coal tar or creosote/fuel oil mixture. Wastewater generated from the wood preserving process was discharged to two shallow, unlined surface impoundments for disposal. The first impoundment (referred to as the CERCLA impoundment) was approximately 60,000 square feet in area. This impoundment filled with sludge and was buried under clean fill in the 1930s. A second impoundment (referred to as the RCRA impoundment) was used from the 1930s until October 1982. EPA determined that the use of these surface impoundments had resulted in contamination of both the soil and groundwater beneath the ponds. Disposal pond soil was classified as RCRA hazardous waste K001, under 40 CFR 261.32. [3, 23]
The soil at three additional areas at Burlington Northern also was determined to be contaminated (the process area, drip track area, and black dock area). These areas are shown on Figure 2. Tie treating operations were completed in the retort building in the process area. Creosote used in the treatment process was also stored in aboveground tanks in this area. Following pressure treatment, the ties were moved to the drip track area for drying. Treated ties were then transported to the black dock area for storage prior to transport off site. [1]
Regulatory Context: In April 1985, a three-party consent agreement was signed by Burlington Northern, the Minnesota Pollution Control Agency (MPCA), and EPA. The consent agreement detailed specific actions and studies to be undertaken concerning the two surface impoundments and three additional areas of contaminated soil. Activities included site monitoring, preparing a treatment study, preparing a feasibility study, submitting closure and post-closure plans, and implementing corrective actions. Based on the consent agreement, EPA issued an Enforcement Decision Document (a predecessor to a Record of Decision - ROD) in June 1986, which identified actions to control the source of contamination, including treatment of soils and sludges, and to prevent hazardous substances from migrating away from the contaminated site. The Enforcement Decision Document required Burlington Northern to excavate and treat soils and sludges which were visibly contaminated and which contained free oils that could migrate to groundwater. [3]
Remedy Selection: The following three alternatives for treatment of
contaminated soils and sludges were considered for the site:
On-site land treatment of contaminated soils and sludges;
On-site incineration of contaminated soils and sludges; and
On-site land treatment of contaminated soils, and off-site incineration of sludges.
On-site land treatment of contaminated soils and sludges was selected for this site because it was identified as protective of human health and the environment, and was the lowest cost alternative. [3]
In 1984, bench- and pilot-scale tests were conducted to evaluate the feasibility of using land treatment for the contaminated soils and sludges from the lagoons. The study consisted of six pilot-scale test plots and six bench-scale reactors which varied in the initial creosote concentration. These tests showed that land treatment was feasible for remediation of these materials. [15]
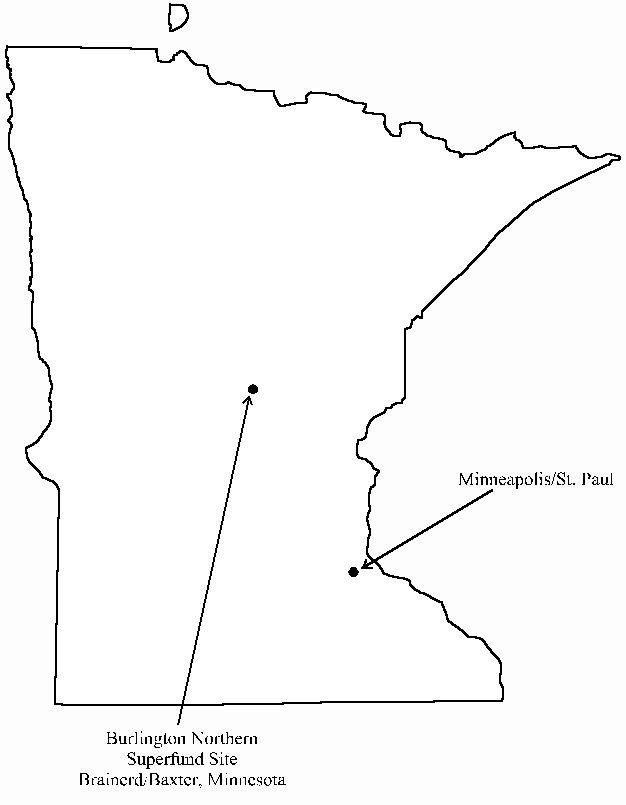
Figure 1. Site Location
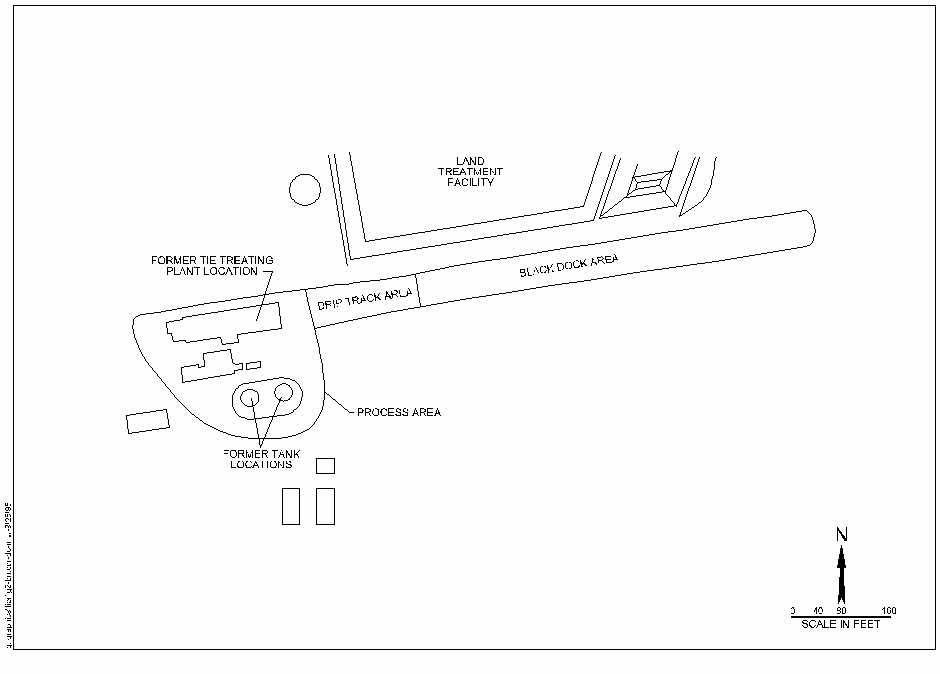
Figure 2. Additional Areas of Contaminated Soil at Burlington Northern [1]
Site Management: PRP lead
Oversight: EPA/State
Remedial Project Manager: Tony Rutter
U.S. EPA Region V
77 W. Jackson Boulevard
Mail Code HSR-6J
Chicago, Illinois 60604
(312) 886-8961
State Contact:Fred M. Jenness
Minnesota Pollution Control Agency
Hazardous Waste Division
Regulatory Compliance Section
Permit and Review Unit
530 Lafayette Road North
St. Paul, Minnesota 55155-4194
(612) 297-8470
Treatment System Vendor: Mindy L. Salisbury
Remediation Technologies, Inc. (ReTeC)
413 Waconta St., Suite 400
St. Paul, MN 55110
(612) 222-0841
Back to Executive Summary |
Table of Contents | Forward to Matrix Description
Type of Matrix Processed Through the Treatment System: soil and sludge
Primary Contaminant Group: Polynuclear Aromatic Hydrocarbons (PAHs), Other Semivolatiles - Nonhalogenated
The Enforcement Decision Document identified visibly contaminated soils as being heavily stained, dark brown to black in color, visibly oily, and usually having a pronounced creosote odor. Table 1 shows the average concentration for PAHs, benzene extractables, and total phenols in visibly contaminated soils in the CERCLA (pre-1930s) and RCRA (post-1930s) surface impoundments. In addition, concentrations ranging from 5 to 30 percent for benzene extractables and 3 to 15 percent for total PAHs were reported for the visibly contaminated soils. [3]
No analytical data were contained in the available references on the concentrations of specific constituents in visibly-contaminated soils in the three additional areas of contaminated soil.
Table 1. Average Concentrations for Visibly-Contaminated Soils in Surface Impoundments [3]
| |
CERCLA Surface Impoundment (mg/kg) |
RCRA Surface Impoundment (mg/kg) |
|---|---|---|
| Naphthalene Acenaphthylene Acenaphthene |
3,105 |
6,494 |
| Total 2-Ring PAHs | 15,565 |
31,464 |
| Fluorene Phenanthrene Anthracene |
1,505 |
2,497 |
| Total 3-Ring PAHs | 5,895 |
11,839 |
| Fluoranthene Pyrene Benzo(a)anthracene Chrysene Benzo(b)fluoranthene Benzo(k)fluoranthene Benzo(a)pyrene Benzo(ghi)perylene Dibenz(a,h)anthracene Indeno(1,2,3)pyrene |
4,650 |
10,053 |
| Total 4- and 5-Ring PAHs | 12,522 |
27,330 |
| Total PAHs | 33,982 |
70,633 |
| Benzene Extractables | 66,100 |
112,500 |
| Total Phenols | 16 |
65 |
The major matrix characteristics affecting cost or performance for this technology and the values measured for each are shown in Table 2.
Table 2. Matrix Characteristics
| Parameter | Value | Measurement Method |
|---|---|---|
| Soil Classification |
Information not provided | Information not provided |
| Clay Content and/or Particle Size Distribution | Information not provided |
Information not provided |
| pH | Information not provided |
N/A |
| Field Capacity | Information not provided |
Information not provided |
N/A - Measurement method not reported for this parameter because resulting value not expected to vary among measurement procedures.
Back to Site Information | Table of Contents | Forward to Treatment System Description
Land Treatment
None
In 1985, a land treatment unit (LTU) was constructed at the Burlington Northern site. The LTU had outer dimensions of approximately 300 by 495 feet (about 150,000 ft2) and an area available for treatment of approximately 255 by 450 feet (about 115,000 ft2). The LTU was constructed over the former RCRA surface impoundment (after the visibly contaminated soils and sludges had been removed). A diagram of the LTU, the leachate collection sump, and the temporary waste stockpile is shown in Figure 3. [1]
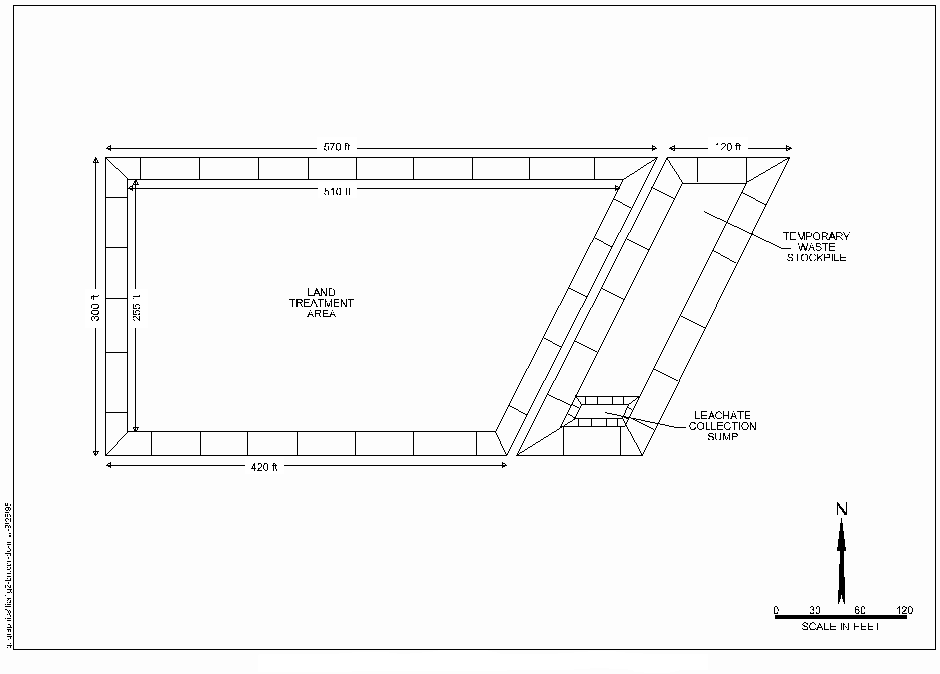
Figure 3. Land Treatment Unit Constructed at Burlington Northern [1]
LTU Construction
The LTU was constructed with the following layers, as shown in Figure 4:
| Depth |
LTU Surface |
| 8 |
Material Treated in 1994 |
| 14 |
Material Treated in 1993 |
| 20 |
Material Treated in 1992 |
| 26 |
Material Treated in 1991 |
| 32 |
Material Treated in 1990 |
| 38 |
Material Treated in 1989 |
| 44 |
Material Treated in 1988 |
| 50 |
Material Treated in 1987 |
| 56 |
Material Treated in 1986 |
| 80 |
Clean, Silty Sand |
| 86 |
Gravel |
| 102 |
Silty Sand Ballast |
| 100-mm HDPE liner |
Figure 4. LTU Construction Layers [1]
The HDPE membrane covered the bottom and the side slopes of the LTU. The bottom of the LTU sloped downward 0.5 percent to the south and west. The LTU was surrounded by containment berms (3 to 1 side slopes) to prevent surface run-on from entering the treatment unit. [1]
The gravel layer operated as a leachate collection system and as a "marking layer" during treatment. Two-foot wide leachate collection drains on 100-foot centers were located in the gravel layer, extending through the gravel layer into the sand ballast to within 1 foot of the liner. The drains were filled with gravel, and perforated pipe wrapped with filter fabric were installed in the drains to collect leachate. The collection system carried leachate to a sump, which was filled with 6-inch rounded cobbles and had a capacity of 50,000 gallons. [1, 2]
LTU Operation
Contaminated soil and sludge excavated from the surface impoundments and other
areas of interest at the site were stored in a temporary stockpile located
adjacent to the LTU. Starting in May 1986, between 1,100 and 1,500 cubic yards
of soil and sludge were spread over the LTU to a depth of 6-8 inches each year.
Dump trucks were used to transport the contaminated materials from the
temporary stockpile to the treatment area. [1]
Land treatment was conducted from May through October each year (referred to as the treatment season), and the system was operated for 9 treatment seasons, between 1986 and 1994. Weather permitting, the treatment area was cultivated weekly to a 12-inch depth with a tractor-mounted rototiller. Thus, some mixing occurred between the current lift and the previous year's lift. One reason for this mixing was to increase the microbial population in the current year's lift. An agricultural disk was used on a periodic basis to level the surface of the LTU. About once every three years, a 24-inch ripper was used to break up the compacted soil layer beneath the 12-inch tilling zone. Irrigation of the LTU was performed periodically to maintain a soil moisture content of approximately 10 percent by weight. Soil pH was maintained between 6.2 and 7.0 with lime addition, and the carbon:nitrogen:phosphorus ratio was maintained near 100:2:1, with cow manure application. [1, 2]
Leachate from the LTU, collected in the sump, was discharged to an on-site equalization tank. Some of the leachate was applied to the LTU as irrigation water, while the remainder was discharged to a local sewer system. [1]
After completion of LTU operation, Burlington Northern placed a cover over the LTU during July and August 1995. EPA reviewed the design documents and approved the design prior to construction. The closure was approved by EPA on January 8, 1996. [22]
The major operating parameters affecting cost or performance for this technology and the values measured for each are shown in Table 3.
Table 3. Operating Parameters [1, 5]
| Parameter |
Value |
Measurement Method |
|---|---|---|
| Mixing Rate/Frequency | Cultivated weekly with rototiller (weather permitting) |
N/A |
| Moisture Content | 10-12.8% by weight | N/A |
| pH | 6.2 to 7.0 | Saturated paste extraction |
| Residence Time | 6 months | N/A |
| Temperature | Information not provided | N/A |
| Hydrocarbon Degradation | 8-58% | Calculated - see Table 5 |
| Nutrients and Other Soil Amendments | Cow manure C:N:P maintained at 100:2:1 |
Nitrogen measured using potassium chloride and water extractions |
| Conductivity | 1.76 mmhos/cm | Saturated paste extraction |
| Sulfur | 0.05% | N/A |
N/A - Measurement method not reported for this parameter because resulting value not expected to vary among measurement procedures.
A timeline for this application is shown in Table 4.
Table 4. Timeline [1, 2, 3, 22]
| Start Date |
End Date |
Activity |
|---|---|---|
| 1907 |
1985 |
Burlington Northern conducted wood preserving operations at the site |
| December 1982 |
- |
Site placed on NPL |
| August 1985 |
October 1985 |
Construction of land treatment unit |
| May 1986 |
October 1994 |
Land treatment of contaminated soil and sludges |
| July 1995 |
August 1995 |
Cover placed over LTU |
Back to Matrix Description | Table of Contents | Forward to Treatment System Performance
A RCRA Part B permit for this site specified the following:
The first specification corresponds to the following cleanup goals for treated soil and sludge:
Total PAHs were identified in this application as the sum of the
concentrations for the following 17 PAHs:
| Naphthalene; | Chrysene; |
| Acenaphthylene; | Benzo(b)fluoranthene; |
| Acenaphthene; | Benzo(k)fluoranthene; |
| Fluorene; | Benzo(e)pyrene; |
| Phenanthrene; | Benzo(a)pyrene; |
| Anthracene; | Indeno(123-cd)pyrene; |
| Fluoranthene; | Dibenzo(ah)anthracene; and |
| Pyrene; | Benzo(ghi)perylene. |
| Benzo(a)anthracene; |
In addition, the permit provided for the following contingency procedures if
the LTU did not meet these cleanup goals at the end of the treatment
period:
In addition to the cleanup goals described above for treatment of soil and sludge, the following concentration limits were identified in the Consent Order as "action levels" for groundwater at Burlington Northern:
| -- Benzo(a)anthracene; -- Benzo(b)fluoranthene; -- Benzo(j)fluoranthene; -- Benzo(k)fluoranthene; -- Benzo(a)pyrene; -- 7H-Dibenzo(c,g)carbazole; -- 5-Methylchrysene; |
-- Indeno(123-c,d)pyrene; -- Dibenzo(a,h)anthracene; -- Dibenzo(a,h)acridine; -- Dibenzo(a,j)acridine; -- Dibenzo(a,e)pyrene; -- Dibenzo(a,i)pyrene; and -- Dibenzo(a,l)pyrene. |
| -- Indene; -- 2,3-Dihydroindence; -- Naphthalene; -- 1-Methylnaphthalene; -- 2-Methylnaphthalene; -- Biphenyl; -- Acenaphthylene; -- Acenaphthene; -- Fluorene; -- Phenanthrene; -- Anthracene; |
-- Fluoranthene; -- Pyrene; -- Benzo(h)fluoranthene; -- Benzo(e)pyrene; -- Perylene; -- Acridine; -- Carbazole; -- 2,3-Benzofuran; --Benzo(b)thiophene; -- Dibenzothiophene; and -- Indole. |
The following action levels for individual constituents in groundwater were also specified. However, these action levels were not required cleanup goals:
| Acenaphthene Anthracene Fluoranthene Fluorene Naphthalene |
- - - - - |
4,000 µg/L 2,000 µg/L 300 µg/L 300 µg/L 30 µg/L |
Phenol (total) 2,4-Dimethylphenol 2,4-Dichlorophenol 2-Methylphenol Biphenyl |
- - - - - |
4,000 µg/L 100 µg/L 20 µg/L 30 µg/L 300 µg/L |
To assess LTU treatment performance, each lift of contaminated soil and
sludge was sampled immediately after application and then monthly through the
end of the treatment season. To facilitate sampling, the LTU was divided into
three areas of approximately equal size. Each month, two sites were sampled in
each of the three areas, resulting in six samples. The sample from each site
consisted of a composite of at least three subsamples from that area. The
samples were analyzed for MCE hydrocarbons and PAHs, and the results for each
of these six samples were averaged. Tables 5 through 9 present the before
treatment (from the beginning of each treatment season, after the new soil lift
was applied in May or June), and after treatment (from the end of each season,
in October or November). Analytical results for these samples from the nine
treatment seasons are shown in Tables 5 through 9, as described below:
Tables 5 through 9 also show the dates on which samples were collected, where available.
At the completion of the last treatment season (1994), samples were collected at four depths in the LTU to assess residual concentrations of MCE hydrocarbons and PAHs. These samples were also analyzed for Microtox® EC 50. Table 10 presents the results for these samples. For each of the four depths sampled, concentrations of MCE hydrocarbons, specific PAHs, and Microtox® EC 50 are presented for the 1994 treatment season (0-8 inches), 1990-1993 treatment seasons (8-32 inches), 1986-1989 treatment seasons (32-56 inches), and the soil layer immediately below the original layer of contaminated material (55-66 inches).
Table 11 summarizes analytical data for selected parameters in the leachate during treatment. The results are from grab samples collected from the treatment area drain tile leachate. More detailed data on leachate are presented in Appendix A. Data were collected for MCE hydrocarbons, 7 PAHs, and 5 acid extractable constituents in the leachate during the 9 treatment seasons.
Table 5. Treatment Performance Data for MCE Hydrocarbons [1, 2, 5, 6, 7, 8, 9]
| Before Treatment |
After Treatment |
|||
|---|---|---|---|---|
| Treatment Season |
Concentration (mg/kg) |
Date Sample Collected |
Concentration (mg/kg) |
Date Sample Collected |
| 1986 |
53,000 |
N/A |
22,000 |
N/A |
| 1987 |
67,000 |
05/20/87 |
48,000 |
10/09/87 |
| 1988 |
74,000 |
05/04/88 |
36,000 |
10/19/88 |
| 1989 |
83,000 |
05/11/89 |
47,000 |
10/24/89 |
| 1990 |
26,000 |
05/21/90 |
24,000 |
N/A |
| 1991 |
53,000 |
N/A |
28,000 |
10/27/91 |
| 1992 |
69,000 |
N/A |
29,000 |
11/11/92 |
| 1993 |
89,000 |
05/07/93 |
38,000 |
10/18/93 |
| 1994 |
62,000 |
06/23/94 |
27,000 |
11/03/94 |
| Average |
64,000 |
- |
33,000 |
- |
N/A - Date sample collected is not available.
Table 6. Treatment Performance Data for Two-Ring PAHs [1, 2, 5, 6, 7, 8, 9]
| Before Treatment |
After Treatment |
|||
|---|---|---|---|---|
| Treatment Season |
Concentration (mg/kg) |
Date Sample Collected |
Concentration (mg/kg) |
Date Sample Collected |
| 1986 |
2,250 |
N/A |
ND (120) |
N/A |
| 1987 |
2,848 |
05/20/87 |
140 |
10/09/87 |
| 1988 |
1,972 |
05/04/88 |
65 |
10/19/88 |
| 1989 |
2,749 |
05/11/89 |
ND (11) |
10/24/89 |
| 1990 |
848 |
05/21/90 |
92 |
N/A |
| 1991 |
1,319 |
N/A |
3 |
10/27/91 |
| 1992 |
99 |
N/A |
9 |
11/11/92 |
| 1993 |
3,269 |
05/07/93 |
108 |
10/18/93 |
| 1994 |
691 |
06/23/94 |
65 |
11/03/94 |
| Average |
1,783 |
- |
68 |
- |
N/A - Date sample collected is not available.
ND - Not detected; value in parentheses is the reported detection limit.
Table 7. Treatment Performance Data for Three-Ring PAHs [1, 2, 5, 6, 7, 8, 9]
| Before Treatment |
After Treatment |
|||
|---|---|---|---|---|
| Treatment Season |
Concentration (mg/kg) |
Date Sample Collected |
Concentration (mg/kg) |
Date Sample Collected |
| 1986 |
9,560 |
N/A |
445 |
N/A |
| 1987 |
8,750 |
05/20/87 |
774 |
10/09/87 |
| 1988 |
6,032 |
05/04/88 |
191 |
10/19/88 |
| 1989 |
2,989 |
05/11/89 |
448 |
10/24/89 |
| 1990 |
2,113 |
05/21/90 |
411 |
N/A |
| 1991 |
2,423 |
N/A |
291 |
10/27/91 |
| 1992 |
265 |
N/A |
163 |
11/11/92 |
| 1993 |
5,927 |
05/07/93 |
401 |
10/18/93 |
| 1994 |
1,287 |
06/23/94 |
225 |
11/03/94 |
| Average |
4,372 |
- |
372 |
- |
Table 8. Treatment Performance Data for Four- and Five-Ring PAHs [1, 2, 5, 6, 7, 8, 9]
|
|
Before Treatment |
After Treatment |
||
|---|---|---|---|---|
| Treatment Season | Concentration (mg/kg) |
Date Sample Collected |
Concentration (mg/kg) |
Date Sample Collected |
| 1986 |
4,350 |
N/A |
1,330 |
N/A |
| 1987 |
6,273 |
05/20/87 |
3,412 |
10/09/87 |
| 1988 |
4,927 |
05/04/88 |
2,889 |
10/19/88 |
| 1989 |
5,149 |
05/11/89 |
2,059 |
10/24/89 |
| 1990 |
3,047 |
05/21/90 |
772 |
N/A |
| 1991 |
2,355 |
N/A |
654 |
10/27/91 |
| 1992 |
262 |
N/A |
392 |
11/11/92 |
| 1993 |
4,275 |
05/07/93 |
711 |
10/18/93 |
| 1994 |
1,566 |
06/23/94 |
505 |
11/03/94 |
| Average |
3,578 |
- |
1,414 |
- |
N/A - Date sample collected is not available.
Table 9. Treatment Performance Data for Total PAHs [1, 2, 5, 6, 7, 8, 9]
| Before Treatment |
After Treatment |
|||
|---|---|---|---|---|
| Treatment Season |
Concentration (mg/kg) |
Date Sample Collected |
Concentration (mg/kg) |
Date Sample Collected |
| 1986 |
16,160 |
N/A |
1,895 |
N/A |
| 1987 |
17,871 |
05/20/87 |
4,326 |
10/09/87 |
| 1988 |
12,931 |
05/04/88 |
3,145 |
10/19/88 |
| 1989 |
10,887 |
05/11/89 |
2,518 |
10/24/89 |
| 1990 |
6,008 |
05/21/90 |
1,275 |
N/A |
| 1991 |
6,097 |
N/A |
948 |
10/27/91 |
| 1992 |
626 |
N/A |
564 |
11/11/92 |
| 1993 |
13,471 |
05/07/93 |
1,220 |
10/18/93 |
| 1994 |
3,544 |
06/23/94 |
795 |
11/03/94 |
| Average |
9,733 |
- |
1,854 |
- |
N/A - Date sample collected is not available.
Table 10. Residual Concentrations of MCE Hydrocarbons and PAHs in the LTU at Completion of Treatment (November 3, 1994) [1]
| Concentration (mg/kg) |
|||||
|---|---|---|---|---|---|
| Depth Sampled (Inches) |
|||||
| |
|
|
|
|
Treatment Goal5 |
| MCE Hydrocarbons | 26,900 |
24,800 |
25,300 |
450 |
21,000 |
| Naphthalene Acenaphthylene Acenaphthene |
2.63 |
2.1 |
9.2 |
0 |
|
| Total 2-Ring PAH | 65.13 |
45.95 |
49.5 |
0.02 |
|
| Fluorene Phenanthrene Anthracene |
23 |
22 |
36 |
0 |
|
| Total 3-Ring PAH | 225 |
128 |
199 |
0.15 |
|
| Fluoranthene Pyrene Benzo(a)anthracene Chrysene |
189 |
112 |
95 |
0.07 |
|
| Total 4-Ring PAH | 382 |
276 |
256 |
0.17 |
|
| Benzo(b)fluoranthene Benzo(k)fluoranthene Benzo(e)pyrene |
44 |
66 |
87 |
0.04 |
|
| Benzo(a)pyrene Indeno(123-cd)pyrene Dibenzo(ah)anthracene Benzo(ghi)perylene |
15.5 |
20.5 |
27.5 |
0.0275 |
|
| Total 5-Ring PAH | 123.5 |
158.4 |
226.7 |
0.225 |
|
| Total PAHs | 795.63 |
608.35 |
731.2 |
0.565 |
8,632 |
| Microtox® EC 50 (5 min, 15 °C) | 15.3 |
8.2 |
4.9 |
70 |
--6 |
1The 0"-8" depth corresponds to the 1994 treatment
season.
2The 8"-32" depth corresponds to the 1990 to 1993
treatment seasons.
3The 32"-56" depth corresponds to the 1986 to 1989
treatment seasons.
4The 56"-66" depth corresponds to the soil layer
immediately below the original layer of contaminated material.
5Treatment goal was established for total PAHs only; no treatment
goal has been established for individual PAH constituents or groups of
constituents (e.g., 2-Ring PAHs) in soils.
6No quantitative treatment goal has been established for
Microtox®.
Table 11. Summary of Concentration Data for Selected Parameters in Leachate During Treatment [1]
| Parameter |
Units |
Groundwater Action Level |
Range of Concentrations Measured |
Number of Sampling Events |
|---|---|---|---|---|
| MCE Hydrocarbons | mg/L |
Not specified |
ND - 600 |
36 |
| PAHs Acenaphthene Acenaphthylene Anthracene Fluoranthene Fluorene Naphthalene Phenanthrene |
|
|
|
|
| Acid Extractables Phenol 2,4-Dimethylphenol 2,4-Dichlorophenol 2-Methylphenol 4-Methylphenol |
|
|
|
|
ND - Not detected; detection limit not provided in available references.
Soil/Sludge:
The treatment performance data presented in Tables 5 and 9 show that the cleanup goal for total PAHs was achieved for all 9 treatment seasons. However, the cleanup goal for MCE hydrocarbons was not met in any of the 9 treatment seasons. The concentrations of MCE hydrocarbons in soil before treatment ranged from 26,000 to 89,000 mg/kg, and from 22,000 to 48,000 mg/kg in soil after treatment, all of which are greater than the cleanup goal of 21,000 mg/kg. The median value for MCE hydrocarbons in soil after treatment was 29,000 mg/kg, and the mean (average) value was 33,000 mg/kg. Because the cleanup goal for MCE hydrocarbons was not met at the end of the treatment period, Burlington Northern implemented the contingency procedure of placing a cover over the treatment area to prevent infiltration of liquid through the treatment zone.
Total PAHs in soil before treatment ranged from 626 to 17,871 mg/kg, and from 564 to 4,326 mg/kg in soil after treatment. The concentrations of total PAHs in the soil after treatment was less than the cleanup goal of 8,632 mg/kg for all 9 treatment seasons. The median value for total PAHs in soil after treatment was 1,275 mg/kg, and the mean (average) value was 1,854 mg/kg.
The residual concentrations of MCE hydrocarbons and PAHs (November 1994 samples) did not vary substantially with depth in the LTU among the treatment seasons, as shown in Table 10. The concentrations of MCE hydrocarbons varied less than 10% with depth through the top 56 inches of the LTU. The concentrations of total PAHs varied approximately 26% with depth through the top 56 inches of the LTU.
In addition, data on residual concentrations show that contaminants in the soils treated in the LTU did not migrate to the uncontaminated soil layer below the LTU. After treatment, the concentrations of MCE hydrocarbons, total PAHs, and Microtox® EC 50 in the uncontaminated soil layer in the LTU immediately below the original layer of contaminated material (the 56- to 66-inch layer) were substantially lower than in the layers of treated soil (the 0- to 56-inch layers).
Analytical data on treatment performance for individual PAH constituents show that treatment efficiency (measured as a percent reduction in average concentration from before treatment to after treatment) decreased with increasing number of ring structures in the PAH molecule. For example, as shown in Tables 6, 7, and 8, two-ring PAHs were reduced an average of 96%, three-ring PAHs were reduced an average of 92%, and four- and five-ring PAHs were reduced an average of 60%. Two-ring PAHs were reduced to concentrations below analytical detection limits for two of the nine treatment seasons.
Leachate:
Analytical data for leachate collected during treatment were compared with the groundwater action levels to evaluate the quality of the leachate. These data for the 36 sampling episodes over a 9-year period are presented in Appendix A and summarized in Table 11. With the exception of naphthalene and 2-methylphenol, the range of concentrations measured in the leachate were below the groundwater action levels. Naphthalene was measured as high as 590 µg/L (versus an action level of 30 µg/L) and 2-methylphenol was measured as high as 87 µg/L (versus an action level of 30 µg/L).
Data are available for characterizing specific constituents, groups of constituents, and indicator parameters in the soil before and after treatment for each of 9 treatment seasons in the LTU. In addition, data are available on leachate quality during the 9 treatment seasons, and on general operating conditions during the treatment operation.
Limited information is provided in the available references on the types of QA/QC protocols used and the QA/QC data that are available concerning this effort. No exceptions to protocol or limits were identified in this information. In addition, no information is available on the specific steps involved with the MCE hydrocarbon analysis. [5]
During the earlier treatment seasons (1986-1990), total hydrocarbons were analyzed using a benzene extraction procedure. The benzene extractable hydrocarbons procedure was based on a modification of Procedure 503C in Standard Methods for Examination of Water and Wastewaters, 15th edition, for measurement of oil and grease by soxhlet extraction. For this application, benzene was substituted for freon as the extraction solvent. The benzene extraction procedure was replaced with a methylene chloride extraction procedure for the latter treatment seasons (1991-1994). According to Burlington Northern, this revision to the analytical procedure is not expected to have had a significant impact on the quality of the analytical results, and results for total hydrocarbons are identified throughout this report as MCE hydrocarbons. [5, 9]
Back to Treatment System Description | Table of Contents | Forward to Treatment System Cost
The land treatment application at Burlington Northern was a PRP-lead project, and Burlington Northern selected ReTeC as the treatment vendor for the project. (The PRP point of contact is Dave Seep, (817) 333 1946.) No additional information is provided in the available references on the process used to procure ReTeC for this remediation project, or on the competitive nature of the procurement.
This is a PRP-lead remediation, and EPA does not have information on the actual costs incurred for this application. No information is provided in the available references on actual treatment system costs, including costs for before-treatment activities (e.g., site work), activities directly attributed to treatment (e.g., system design, construction, and operation), or after-treatment activities, if any. In addition, no information is provided in the available references on actual costs per unit (e.g., ton, cubic yard) of soil treated.
No information was provided by the vendor on site-specific factors that affect project costs for similar land treatment applications.
Back to Treatment System Performance | Table of Contents | Forward to Observations and Lessons Learned
Back to Treatment System Cost | Table of Contents | Forward to References
This case study was prepared for the U.S. Environmental Protection Agency's Office of Solid Waste and Emergency Response, Technology Innovation Office. Assistance was provided by Radian International under EPA Contract No. 68 W3 0001 and U.S. Army Corps of Engineers Contract No. DACA45-96-D-0016.
Back to Observations and Lessons Learned | Table of Contents | Forward to Appendix A - Individual PAH Analytical Results
Table A-1. Concentrations of Selected Parameters in Leachate During Treatment [1]
| Groundwater |
Sampling Date |
||||||||||||||
|---|---|---|---|---|---|---|---|---|---|---|---|---|---|---|---|
| Parameter |
Units |
Action Level |
06/17/86 |
08/07/86 |
10/14/86 |
05/20/87 |
08/21/87 |
||||||||
| MCE Hydrocarbons | mg/L |
-- |
3.4 |
7.9 |
2.5 |
1.5 |
19 |
||||||||
| PAHs Acenaphthene Acenaphthylene Anthracene Fluoranthene Fluorene Naphthalene Phenanthrene TOTAL PAH |
|
|
|
|
|
|
|
||||||||
| Acid Extractables Phenol 2,4-Dimethylphenol 2,4-Dichlorophenol 2-Methylphenol 4-Methylphenol |
|
|
|
|
|
|
|
||||||||
| Sampling Date |
|||||||||||||||
| Parameter |
Units |
Groundwater |
North Drain 05/04/88 |
South Drain 05/04/88 |
North Drain 10/19/88 |
South Drain 10/19/88 |
|
|
|
||||||
| MCE Hydrocarbons | mg/L |
-- |
9 |
8 |
144 |
144 |
600 |
20 |
10 |
||||||
| PAHs Acenaphthene Acenaphthylene Anthracene Fluoranthene Fluorene Naphthalene Phenanthrene TOTAL PAH |
|
|
|
|
|
|
|
|
|
||||||
| Acid Extractables Phenol 2,4-Dimethylphenol 2,4-Dichlorophenol 2-Methylphenol 4-Methylphenol |
|
|
|
|
|
|
|
|
|
||||||
ND - Not detected; detection limit not provided in available references.
| Groundwater |
Sampling Date |
|||||||
|---|---|---|---|---|---|---|---|---|
| Parameter |
Units |
Action Level |
05/21/91 |
06/26/91 |
07/25/91 |
08/20/91 |
09/19/91 |
10/27/91 |
| MCE Hydrocarbons | mg/L |
-- |
ND |
20 |
20 |
20 |
ND |
ND |
| PAHs Acenaphthene Acenaphthylene Anthracene Fluoranthene Fluorene Naphthalene Phenanthrene TOTAL PAH |
|
|
|
|
|
|
|
|
| Acid Extractables Phenol 2,4-Dimethylphenol 2,4-Dichlorophenol 2-Methylphenol 4-Methylphenol |
|
|
|
|
|
|
|
|
| Groundwater |
Sampling Date |
|||||||
| Parameter |
Units |
Action Level |
05/21/92 |
06/29/92 |
07/21/92 |
08/20/92 |
09/17/92 |
11/11/92 |
| MCE Hydrocarbons | mg/L |
-- |
14 |
29 |
ND |
ND |
116 |
51 |
| PAHs Acenaphthene Acenaphthylene Anthracene Fluoranthene Fluorene Naphthalene Phenanthrene TOTAL PAH |
|
|
|
|
|
|
|
|
| Acid Extractables Phenol 2,4-Dimethylphenol 2,4-Dichlorophenol 2-Methylphenol 4-Methylphenol |
|
|
|
|
|
|
|
|
ND - Not detected; detection limit not provided in available references.
| Groundwater |
Sampling Date |
|||||||
|---|---|---|---|---|---|---|---|---|
| Parameter |
Units |
Action Level |
05/07/93 |
06/21/93 |
07/26/93 |
08/23/93 |
09/20/93 |
10/18/93 |
| MCE Hydrocarbons | mg/L |
-- |
110 |
123 |
21 |
96 |
153 |
15 |
| PAHs Acenaphthene Acenaphthylene Anthracene Fluoranthene Fluorene Naphthalene Phenanthrene TOTAL PAH |
|
|
|
|
|
|
|
|
| Acid Extractables Phenol 2,4-Dimethylphenol 2,4-Dichlorophenol 2-Methylphenol 4-Methylphenol |
|
|
|
|
|
|
|
|
| Groundwater |
Sampling Date |
|||||||
| Parameter |
Units |
Action Level |
06/23/94 |
07/26/94 |
08/15/94 |
09/07/94 |
10/13/94 |
11/03/94 |
| MCE Hydrocarbons | mg/L |
-- |
ND |
ND |
11 |
ND |
1 |
ND |
| PAHs Acenaphthene Acenaphthylene Anthracene Fluoranthene Fluorene Naphthalene Phenanthrene TOTAL PAH |
|
|
|
|
|
|
|
|
| Acid Extractables Phenol 2,4-Dimethylphenol 2,4-Dichlorophenol 2-Methylphenol 4-Methylphenol |
|
|
|
|
|
|
|
|
ND - Not detected; detection limit not provided in available references.