
|
Cost and Performance
Report:
|
Preparation of this report has been funded wholly or in part by the U.S. Environmental Protection Agency under Contract Number 68-W3-0001. It has been subject to administrative review by EPA headquarters and Regional staff and by the technology vendor. Mention of trade names for commercial products does not constitute endorsement or recommendation for use.
This report presents cost and performance data for a soil vapor extraction (SVE) treatment application at the Fairchild Semiconductor Corporation Superfund Site (Fairchild) in San Jose, California. The SVE system, which consisted of 39 extraction wells, operated from January 1989 through April 1990 as part of a remedial action. Contaminants of concern at the site included 1,1,1-trichloroethane (TCA), 1,1-dichloroethene (DCE), tetrachloroethene (PCE), xylene, Freon-113, acetone, and isopropyl alcohol (IPA). This was an early application of SVE at a site with complex hydrogeology, and is notable for its use of aquifer dewatering and slurry wall installation prior to treatment.
The Fairchild site is a former semiconductor manufacturing facility which operated from April 1977 until its closure in October 1983. In late 1981, Fairchild Semiconductor Corporation discovered that an underground organic solvent storage tank had failed, resulting in soil contamination and on- and off-site groundwater contamination by a mixture of solvents, including TCA, DCE, PCE, and xylene. An estimated 60,000 gallons of solvents were released.
In 1985, EPA and the State of California entered into a multi-site cooperative agreement with Fairchild which included the San Jose site. Fairchild conducted site remediation activities, including removal of the failed tank, excavation and disposal of contaminated soil, installation and operation of a groundwater extraction and treatment system, installation and operation of the SVE system, sealing several wells to prevent cross-contamination of aquifers, and construction of a slurry-bentonite wall to contain contaminated groundwater on-site. The California Regional Water Quality Control Board established a soil cleanup goal for this remediation of a total contaminant extraction rate of less than 10 lbs/day, along with specific performance goals for individual wells.
During 16 months of operation, the SVE system removed approximately 16,000 pounds of solvents from the soil. The most rapid reductions in contaminant concentrations occurred during the first two months of SVE system operation. The system achieved an extraction rate of less than 10 pounds per day within 8 months of system operation.
The actual cost for treatment using the SVE system was $3,900,000, consisting of $2,100,000 in capital costs, and $1,800,000 in operating costs, corresponding to a calculated cost of $93 per cubic yard of soil treated (42,000 cubic yards) and $240 per pound of contaminant removed.
Table of Contents | Forward to Site Information
Fairchild Semiconductor Corporation
San Jose, California
CERCLIS #: CAD097012298
ROD Date: 20 March 1989
Type of Action: Remedial
Treatability Study Associated with Application? Yes (see Appendix A)
EPA SITE Program Test Associated with Application? No
Operating Period: 1/5/89 - 4/20/90
Quantity of Material Treated During Application: 42,000 cubic yards of soil
Historical Activity That Generated Contamination at the Site:
Semiconductor manufacturing
Corresponding SIC Code: 3674 (Semiconductors and Related Devices)
Waste Management Practices That Contributed to Contamination: Underground
Storage Tank (failed underground waste solvent tank)
Site History: The Fairchild site, located in south San Jose, California, as shown in Figure 1, is a former semiconductor manufacturing facility. The facility operated from April 1977 until its closure in October 1983. In late 1981, Fairchild Semiconductor Corporation discovered that an underground organic solvent storage tank had failed, resulting in soil contamination and on- and off-site groundwater contamination by a mixture of solvents. An estimated 60,000 gallons of waste solvent were released. [5, 6]
Figure 1. Site Location
Interim remedial cleanup activities of the soil and groundwater at the site began in 1982. Fairchild removed the failed tank and excavated and disposed 3,400 cubic yards of soil in a permitted hazardous waste facility in 1982. Installation of a hydraulic control system in 1982 included groundwater extraction and treatment, to prevent further migration of contaminants and to extract contaminated groundwater from on-site and off-site recovery wells. In 1983, Fairchild sealed wells that provided potential pathways for contaminant migration to prevent contaminated groundwater from the shallow aquifers from entering, and contributing to further contamination of the deeper aquifers. Fairchild installed a slurry-bentonite wall around the site perimeter in 1986 to contain contaminated groundwater on site within the shallower aquifers. [5, 6]
Fairchild conducted remedial actions at the site in accordance with a Remedial Action Plan (RAP) prepared in October 1988. The RAP identified specific activities, including soil vapor extraction of on-site soils, designed to further reduce the concentration of chemical contaminants in soil and groundwater at the site. [5, 6]
Regulatory Context: In 1985, the State of California and EPA entered into a multi-site Cooperative agreement, which included remediation activities at the Fairchild site in San Jose, California. As a result of the agreement, the California Regional Water Quality Control Board (RWQCB) identified site cleanup requirements (SCR) in Order No. 89-16, signed on January 18, 1989, [10] and described in a Record of Decision signed in March 1989. [6] Order No. 89-15, also signed on January 18, 1989, specified requirements for discharge of extracted groundwater to surface waters. [9] As discussed below under Cleanup Goals and Standards, the RWQCB subsequently amended the SCR to allow the expedited completion of soil cleanup activities. [8]
Remedy Selection: Soil vapor extraction was selected as the remedy for contaminated soil at the Fairchild Superfund site based on treatability study results and because it conserves water more than a pump and treat program (i.e., less groundwater extraction). [6]
Site Management: PRP Lead
Oversight: California Regional Water Quality Control Board
Remedial Project Manager:
Belinda Wei
U.S. EPA Region 9
75 Hawthorne Street
San Francisco, CA 94105
(415) 744-2280
State Contact:
Stephen Hill (primary contact for this application)
California Regional Water Quality Control Board
2101 Webster Street, Suite 500
Oakland, CA 94612
(510) 286-0433
Treatment System Vendor:
Dennis L. Curran
Canonie Environmental Services Corporation
441 N. Whisman Road, Building 23
Mountain View, CA 94043
(415) 960-1640
Back to Executive Summary
| Table of Contents |
Forward to Matrix Description
Type of Matrix Processed Through the Treatment System: Soil (in situ)
Primary Contaminant Groups: Halogenated and Nonhalogenated Volatile Organic Compounds
The following solvents were detected in soils at the Fairchild Semiconductor site: TCA, DCE, IPA, xylenes, acetone, Freon-113, and PCE. TCA was measured at concentrations as high as 3,530 mg/kg and xylenes as high as 941 mg/kg. The maximum concentration of total solvents (including TCA, 1,1-DCE, IPA, xylenes, acetone, Freon-113, and PCE) detected in soil samples analyzed from the Fairchild site, prior to the remedial action, was 4,500 mg/kg. As described below under site geology/stratigraphy, and shown in Figure 2, the concentration of certain contaminants (e.g., TCA) was plotted against location in the subsurface, and concentration contours were identified. Figure 2 shows TCA contours for 1, 10, and 100 mg/kg of TCA; contours were also identified for 1,000 mg/kg of TCA at the site. [2]
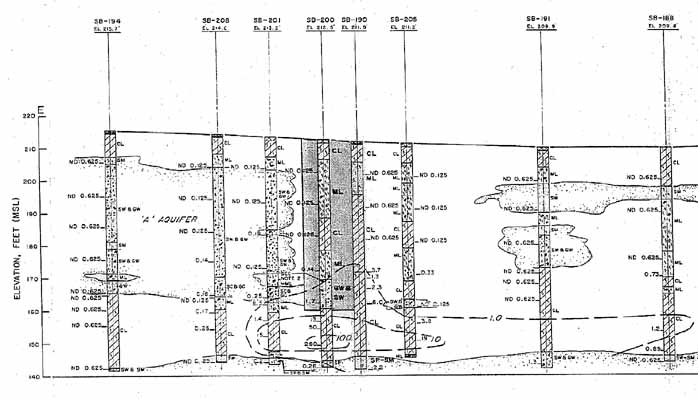
Figure2. TCA concentrations in Soil profileE-E', Measured in February - June 1987 [14]
The major matrix characteristics affecting cost or performance for this technology and their measured values are presented in Table 1. A particle size distribution for one soil boring (SB-174) is shown in Figure 3.
Table 1. Matrix Characteristics [4, 11]
| Parameter | Value | Measurement Procedure |
|---|---|---|
| Soil Classification | Sands, silts, and clays;
U.S.C.S. Soil types SW, SM, ML, and CL. |
Sieve Analysis |
| Clay Content and/or Particle Size Distribution | See Figure 2 | Sieve Analysis |
| Moisture Content | Not Available | -- |
| Air Permeability | 0.12-0.83 cm/sec | Aquifer Performance Tests |
| Porosity | Not Available | -- |
| Total Organic Carbon | Not Available | -- |
| Nonaqueous Phase Liquids | Not Present | -- |
| Transmissivity | 69,000-810,000 gpd/ft | Aquifer Performance Tests |
Figure 3. Particle Size Distribution for Soil Boring 174 [11]
The Fairchild site is located in a subarea of the South Bay Drainage Unit known as the Santa Teresa Subarea, or the Santa Teresa Plain. The topography of the floor of the plain is generally flat to gently sloping, with overall valley drainage to the northwest. The floor of the plain is underlain by Quaternary alluvium, which likely was deposited by the ancestral Coyote Creek as it meandered across the basin. [4]
The site consists of 330 to 360 feet of unconsolidated alluvial deposits overlying bedrock. The structure of the alluvium is highly complex, as shown on Figure 2 for site profile E-E’, consisting of layers of water-bearing sand and gravel alternating with silt and silty-clay layers which act as aquitards. Figure 2 also shows the concentration of TCA in the soil at the site, near soil boring (SB)-200.
Four distinct aquifer systems have been identified in the alluvium as aquifers "A", "B", "C", and "D", with "A" being the shallowest at a depth ranging from 10 to 40 feet below ground surface (BGS). The B aquifer ranges from 50 to more than 70 feet BGS. The alternating sand and gravel layers range in thickness from several feet to approximately 140 feet in thickness while the silt and silty-clay layers range from several feet to approximately 60 feet in thickness. An aquitard (silty-clay layer) identified between the "A" and "B" aquifer (the "AB" aquitard) ranges between 20 and 70 feet BGS. Aquifers merge or are absent in some locations in the site area. [2]
Back to Site Information | Table of Contents | Forward to Treatment System Description
Soil Vapor Extraction
Post-treatment (air) using carbon adsorption
System Description
The SVE system used at Fairchild consisted of 39 extraction wells, installed in the area of contaminated soil. As shown in Figure 4, the majority of the extraction wells were screened in the "A-B" aquitard. The "A" and "B" aquifers had been dewatered prior to installation of the extraction wells. In addition to the extraction wells, the SVE system contained air inlet wells, installed in areas of uncontaminated soil, to provide a means for bringing additional air into the area of contaminated soil. The vendor performed a treatability study, described in Appendix A, prior to the full-scale treatment activities to determine design parameters for the full-scale application. [12]
Figure 4. SVE System Well Location Plan
[12]
A slurry wall and groundwater extraction system were used at Fairchild to dewater the soil. These items also controlled the flow of groundwater and were used to prevent contaminant migration. Groundwater was extracted from recovery wells within the slurry wall enclosures to lower the water elevation inside the slurry wall and maintain inward gradients across the wall. These activities also assisted in control and were used for containment of soil vapors for the SVE system.
Each extraction well was equipped with a submersible pump to remove groundwater that collected in the well. The pumps in the vapor extraction wells were connected by underground piping to the existing groundwater treatment system, which consisted of air stripping and discharge to a surface water. [12]
As shown in Figure 5, the extraction wells were connected to a vapor extraction and treatment system, consisting of vacuum pumps, a dehumidification unit, and vapor phase granular activated carbon (GAC).
Figure 5. SVE System Equipment Location Plan [12]
Two vacuum pumps with a capacity of approximately 4,500 cubic feet per minute (cfm) at 20 inches of mercury (Hg) were used to remove soil vapors. Each vacuum pump was powered by a 250-horsepower high efficiency electric motor. [2, 12]
Five GAC adsorption units were used to capture the organic compounds extracted in the soil vapors. Soil vapors were first routed to two 3,000-pound GAC beds operating in parallel, followed by a secondary set of two 3,000-pound GAC beds operating in parallel, and then to a final, single 3,000-pound GAC bed. [12]
System Operation
The SVE system was designed to operate continuously five days a week. At any one time, the system operated a maximum of 25 of the 39 extraction wells. The system was operated over 427 days for a total of 9,800 hours between January 5, 1989 and April 20, 1990. The vacuum applied to the wells was maintained at a constant level of 15 inches of Hg during the operation. [2]
During the start-up period, several modifications were made to the SVE system, resulting in a 3-month delay in system operation. During this period, unexpectedly high chemical concentrations detected in air samples collected from the well line resulted in contaminant breakthrough and required modifications to the sampling procedures. Circuit breakers and other components in the vacuum pumps did not operate properly and were replaced or modified. The carbon treatment vessels were found to be undersized and were replaced with a larger series of units. [12]
Because of the limited exposure of workers to the chemicals, Level D health and safety protective measures were employed, and the work was performed in accordance with the State-approved health and safety plan. [16]
The major operating parameters affecting cost or performance for this technology and the values measured for each are presented in Table 2.
Table 2. Operating parameters [2]
| Parameter | Value |
|---|---|
| Air flow rate | 28 scfm (Aquifer A); 144 scfm (Aquifer B); 66 scfm (Aquitard A-B) |
| Operating Vacuum | 15 inches of Hg |
A timeline for this application is shown in Table 3.
Table 3. Timeline [2]
| Start Date | End Date | Activity |
|---|---|---|
| 04/77 | 10/83 | Fairchild Semiconductor manufacturing facility conducts operations at San Jose location |
| 10/81 | -- | Discovery of 60,000-gallon waste solvent UST leak |
| 11/81 | '89 | Interim Remedial measures conducted |
| 4/87 | 8/87 | Pilot-study soil vapor extraction system conducted |
| 10/88 | 12/88 | Start-up activities conducted |
| 1/89 | 4/90 | Full-scale soil vapor extraction system operational |
| 3/89 | -- | Record of Decision signed |
| 7/89 | -- | Soil verification samples collected |
| 12/93 | -- | 5-Year Report submitted to CA RWQCB |
Back to Matrix Description | Table of Contents | Forward to Treatment System Performance
The State board established cleanup goals for the SVE remedial action for both individual vapor extraction wells and the overall SVE system in terms of contaminant removal rates. The State required air extraction from individual wells until the contaminant removal rate from the well decreased to 10% (or less) of the initial removal rate, the contaminant removal rate declined at a rate of less than 1% per day for 10 consecutive days, or SVE system operation achieved a total contaminant removal rate of less than 10 lbs/day. [2]
The ROD and the California RWQCB Order originally established soil cleanup goals of 1 mg/kg for each of five contaminants: TCA, DCE, xylenes, Freon-113, and PCE. [6, 9] As a result of an appeal by Fairchild of several aspects of the SCR, the State Board issued an amendment of the Order in May 1990, which established the cleanup goals described above. [8]
Figure 6 shows the contaminant removal rate in pounds per day
for the SVE system as a function of time for the first 11 months of full-scale
system operation (January 5 - December 1, 1988). Cumulative mass of
contaminants removed is plotted as a function of time on Figure 7. The mass of
contaminants removed was calculated using analytical results from charcoal tube
samples of extracted soil vapors collected from each extraction well, along
with extraction well flow rate data. Samples were collected several times a
month for the first 6 months of operation, and approximately once per month
during the latter part of the operation. Samples were desorbed in a laboratory
and analyzed using EPA SW-846 Methods 8010, 8020, and 8240.
Figure 6. Contaminant Removal Rate as a
Function of Time [2]
Figure 7. Cumulative Mass of Contaminants
Removed as a Function of Time [13]
To assess the effect of shutting off individual extraction wells, several wells that met the shutoff criteria were shut off and turned back on between October 1988 and April 1989 at intervals of two, four, and six weeks. Table 4 shows the results from this effort for seven wells.
Table 4. Effect of Shutting Off Extraction Wells [13]
| Extraction Well No. | VOC Concentration at Shutoff (ppmv) | Concentration Following Shutdown Period (ppmv) | ||
|---|---|---|---|---|
| 2 Weeks | 4 Weeks | 6 Weeks | ||
| AE-9A | 23.2 | 17.9 | NA | NA |
| AE-13A | 744.3 | 523.1 | NA | NA |
| AE-14A | 627.5 | 363.0 | NA | NA |
| AE-16A | 14.1 | 13.7 | NA | NA |
| AE-7A | 64.5 | NA | 53.0 | NA |
| AE-15A | 27.5 | NA | 11.6 | NA |
| AE-20(A) | 5.7 | NA | NA | 1.6 |
Soil boring samples were collected at several site locations to assess the effectiveness of the SVE system operation on soil concentrations during the first seven months of treatment. Six soil borings were collected in the April to June 1987 period (pre-remediation) and July 1989 (samples taken after approximately 7 months of operation). One of the soil borings was drilled within the area of highest contaminant concentration at the site (SB-271, drilled within the 1,000 mg/kg TCA contour at the site in June 1988); one within a less contaminated area (SB-272, drilled within the 100 mg/kg TCA contour); three within a less contaminated area (SB-273, -274, and -275, drilled within the 10 mg/kg TCA contour), and one within the least contaminated area (SB-276, completed within the 1 mg/kg TCA contour). Soil boring samples were analyzed using SW-846 Methods 8010, 8020, and 8240; the analytical results are shown in Table 5. [13]
Additional soil samples were collected in January 1995 to
evaluate the current concentrations in soils. The data from these borings are
not available at this time. [16]
Table 5. Comparison of Pre-Remediation and
July 1989 Soil Boring Analysis [2, 13]
| Soil Boring Number | TCA (mg/kg) | DCE (mg/kg) | Xylenes (mg/kg) | Acetone (mg/kg) | IPA (mg/kg) | Freon-113 (mg/kg) | PCE (mg/kg) | |||||||
|---|---|---|---|---|---|---|---|---|---|---|---|---|---|---|
| Preremediation | 07/89 | Preremediation | 07/89 | Preremediation | 07/89 | Preremediation | 07/89 | Preremediation | 07/89 | Preremediation | 07/89 | Preremediation | 07/89 | |
| SB-271 | 3530 | 416 | 16.6 | 2.2 | 941 | 462 | 18 | 281 | ND | 134 | ND | ND | ND | 4.1 |
| SB-272 | 40.6 | 79 | 3.4 | 2.5 | 19.2 | 156 | ND | 1.5 | ND | 0.9 | ND | ND | ND | 1.2 |
| SB-273 | 266 | 37.3 | 12.5 | 1.5 | 189 | 85.6 | 7.7 | 3.5 | 0.02 | 1.8 | ND | ND | 2.2 | 0.5 |
| SB-274 | 12.2 | 7.8 | 1.6 | 0.3 | 4.8 | 5.5 | 7.6 | 1.9 | ND | ND | NA | ND | ND | 0.04 |
| SB-275 | 6.4 | 5.5 | 0.5 | 1.5 | ND | 1.2 | ND | 2.9 | ND | 0.4 | ND | ND | ND | ND |
| SB-276 | 1.1 | 0.1 | 0.05 | 0.01 | ND | ND | ND | ND | ND | ND | ND | ND | ND | ND |
ND - Not detected
NA - Not analyzed
Pre-remediation samples collected April - June 1987.
The treatment performance data shown in Figures 6 and 7 indicate that overall SVE system operation removed approximately 16,000 pounds of solvents from the soil during 16 months of operation (January 1989 to April 1990), at which time the system was shut off. The system achieved the cleanup goal of less than 10 lbs/day contaminant removal rate 3.6 lbs/day after 16 months of operation. The extraction rate decreased from a maximum of 130 pounds per day to less than 4 pounds per day when it was shut off.
The SVE system was operated for 8 months after the time when the 10 lbs/day goal was achieved to remove additional contaminants from the soil (i.e., to the point where the soil was believed to no longer leach contaminants to the groundwater).
In addition, Figures 6 and 7 indicate that the rate of contaminant extraction using the SVE system increased rapidly during the initial stages of system operation (2 months) and then decreased at a more gradual rate.
The data in Table 4 indicate that shutting off individual extraction wells did not increase the concentrations in the soil vapors after two, four, or six weeks of well shutdown. The SVE system was shut off on April 20, 1990.
A review of the data in Table 5 indicates that the concentration of many of the chemical contaminants in the soil borings had decreased by July 1988 (seven months of SVE system operation). However, concentrations of several contaminants increased during this period, including acetone in SB-271 and SB-275, TCA in SB-272, xylenes in SB-272 and SB-274, IPA in SB-271 through 273 and SB-275, and PCE in SB-271 and SB-272. The variation in contaminant concentrations in the soil may be attributable to variation in contamination across the areas where the soil borings were collected.
Data are available for concentrations of contaminants in the soil before treatment and at a mid-point of the treatment process (after 7 of the 16 months of SVE system operation). Confirmatory soil samples were collected by the vendor after the remediation was completed; however, the data from these samples are not available at this time. In addition, data are available for characterizing concentrations of contaminants in soil vapors from each extraction well over the course of the treatment operation.
The QA/QC program used throughout the remedial action met the EPA and the State of California requirements. All monitoring was performed using EPA-approved methods, and the vendor did not note any exceptions to the QA/QC protocols. [2]
Back to Treatment System Description | Table of Contents | Forward to Treatment System Cost
The PRPs contracted with Canonie Environmental to construct and operate the SVE system at the site. Canonie Environmental used several subcontractors to implement specific aspects of the operation. [12]
The treatment vendor provided estimated (projected) and actual treatment cost information to the California RWQCB. The actual treatment cost of $3,900,000 was reported by the vendor in terms of capital costs and operation and maintenance costs. The actual capital costs for the soil vapor extraction program were $2,100,000 (this does not include costs for construction of the slurry wall or for aquifer dewatering), and actual operation and maintenance costs totalled approximately $1,800,000 for 16 months of operation. This corresponds to $240 per pound of contaminants removed and $93 per cubic yard of soil treated.
Because the specific items included in these totals is not available, a cost breakdown using the interagency Work Breakdown Structure (WBS) is not provided in this report.
The total projected costs (based on 24 months of operation) were $4,200,000. The projected capital cost of the soil vapor extraction system, including installation of extraction wells, installation of a vapor-phase treatment system, preparation of the treatment area, and engineering services, was approximately $2,200,000. Projected operation and maintenance costs, including water quality sampling and analysis, water level monitoring, equipment maintenance, engineering services, and carbon regeneration, was approximately $2,000,000. [2, 11]
The actual costs for this project were approximately 7% less than the projected costs because the amount of time required for the remediation was less than originally estimated.
The number of cubic yards of soil treated at Fairchild is an estimate of the amount of soil influenced by SVE, provided by the vendor; the actual amount of soil treated is not available at this time for comparison with the estimate.
Actual and projected capital and operations and maintenance cost data are available from the treatment vendor for this application. A detailed breakdown of the cost elements included in the total actual costs is not available at this time. Limited information on the items included in the total projected costs was provided by the vendor, as discussed above.
Back to Treatment System Performance | Table of Contents | Forward to Observations and Lessons Learned
Back to Treatment System Cost | Table of Contents | Forward to References
This case study was prepared for the U.S. Environmental Protection Agency's Office of Solid Waste and Emergency Response, Technology Innovation Office. Assistance was provided by Radian Corporation under EPA Contract No. 68-W3-0001.
Back to Observations and Lessons Learned | Table of Contents | Forward to Appendix A - Treatability Study Results
Summary
| Identifying Information | |
| Site Location: | San Jose, CA |
| ROD Date: | 03/20/89 |
| Historical Activity at Site - SIC Codes: | 3674 (Semiconductors and Related Devices) |
| Historical Activity at Site - Management Practices: | Underground Storage Tanks (failed underground waste solvent tank) |
| Dates of Operation: | 1977 to 1983 |
| Site Contaminants: | VOCs, including tetrachloroethylene (PCE), trichloroethane (TCA), dichloroethylene (DCE), Freon-113, acetone, xylenes; and isopropyl alcohol (IPA) |
| Type of Action: | Remedial |
| Did the ROD include a contingency based on treatability study results? | No |
| Treatability Study Information | |
| Type of Treatability Study: | Pilot-Scale |
| Duration of Treatability Study: | 04/20/87 through 06/87 |
| Media Treated: | Soil (in situ) |
| Quantity Treated: | Not Available |
| Treatment Technology: | Soil Vapor Extraction One extraction well, 16 primary air inlet wells, 12 peripheral monitoring wells, a vacuum pump or blower, and granulated activated carbon units |
| Target Contaminants of Concern: | VOCs, including TCA, DCE, PCE, xylene, Freon-113, acetone, and IPA |
| Conducted before the ROD was signed: | Yes |
| Additional treatability studies conducted: | No |
| Remedial or Removal Action: | Remedial |
| Technology selected for full-scale application: | Yes |
| Treatability Study Strategy | |
| Number of Runs: | Study was conducted in three stages: Stage 1 utilized a vacuum pump at 25 inches Hg; Stage 2 utilized a vacuum blower at 9 inches Hg; and Stage 3 utilized a vacuum blower at 14.5 inches Hg |
| Key Operating Parameters Varied: | Vacuum equipment, vacuum pressure |
Identifiying Information
Type of Treatability Study
Pilot-Scale Soil Vapor Extraction Treatability Study of Soil Contaminated with TCA, DCE, PCE, Xylene, Freon-113, Acetone, and IPA
Treatability Study Strategy
Treatability Study Purpose
The following purposes were identified for the treatability study:
The SVE report was submitted to comply with a provision of the Site Cleanup Requirements which required conducting treatability studies and reporting the results to the California Regional Water Quality Control Board (CRWQCB).
The treatability study was conducted in three stages in which the vacuum and extraction equipment were varied. [11]
Cleanup Goals/Standards for the Fairchild Semiconductor Site
Cleanup goals are described in Section 4.1 of the full-scale treatment report for the Fairchild site; however, these goals had not been established at the time the treatability study was conducted.
Treatment System Description
Treatment System Description and Operation
Treatment System Description
The pilot-scale SVE treatment system, shown on
Figure A-1, consisted of one extraction well (RW-23A), 16 primary air inlet
wells and 12 peripheral wells for monitoring, a vacuum pump (used in Stage 1 of
the study), or a vacuum blower (used in Stages 2 and 3 of the study), and
granulated activated carbon (GAC) units for primary and backup treatment of
emissions. Location of some wells is shown in Figure 5 of the full-scale
report; however, a figure showing all wells used in the treatability study was
not included in the available documentation.
Figure A-1. Pilot-Scale SVE System
[11]
The extraction well RW-23A, shown on Figure A-2, was modified
from a groundwater recovery well to an air extraction well to draw vapors from
the unsaturated portion of the "A" aquifer. Through design and
equipment modifications, the well was altered to maintain groundwater at 50
feet below ground surface (BGS) to provide sufficient air flow, and to allow
the attachment of a six-inch diameter air flow duct. The 17 primary air inlet
wells were installed in eight-inch diameter soil borings drilled using the
rotary-stem auger method. The peripheral well network consisted of 12
previously installed observation wells.
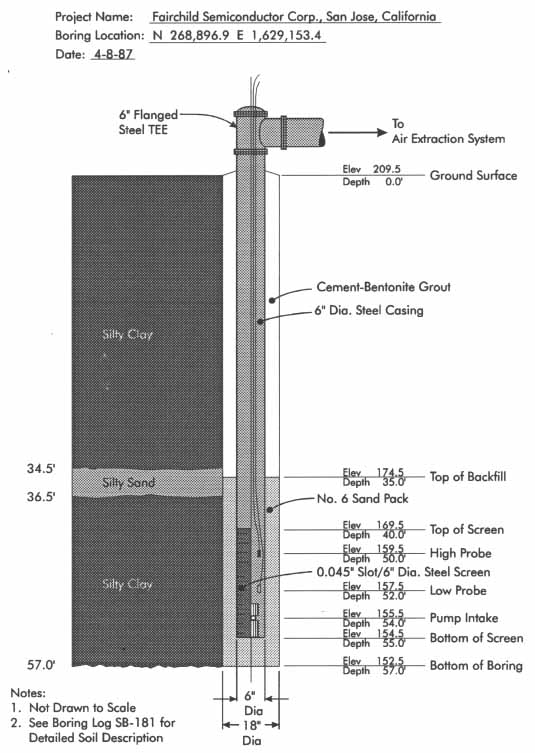
Figure A-2. Extraction Well RW-23a
[11]
In Stage 1 of the study, a Becker Model U2.250 vacuum pump was used to extract air from Well RW-23A. The pump was rated at 160 acfm air flow at 1750 rpm. Stages 2 and 3 of the study used a Roots RCS Model 412 vacuum blower, rated at 680 acfm at 1500 rpm. Both vacuum units were air-cooled and oil-lubricated and utilized positive displacement.
Extracted air was treated using a primary and secondary set of GAC treatment units. As shown in Figure A-1, both the primary and secondary treatment units contained five sub-units in parallel, containing 150 pounds of GAC in a modified 55-gallon drum. The primary unit was designed to remove VOCs and SVOCs from the extracted vapors, and the secondary unit was designed to ensure that emission of these compounds did not occur. [11]
Treatment System Operation
The treatability study was conducted in three stages, as described below.
Stage 1 of the pilot study began on April 20, 1987. Initially, the vacuum pump operated at an inlet vacuum of approximately 25 inches of Hg which resulted in an air flow of 50 scfm. After one week of operation, the vacuum at the well head stabilized at 13.5 inches of water. During Stage 1, the air inlet wells were capped to enhance the removal of soil vapor. Measurable vacuums were recorded for sixteen of the 18 primary air inlet wells during Stage 1. The highest recorded vacuum was 0.40 inches of water at both Well AI-4L and AI-4M, 8 feet from the extraction well. The smallest recorded vacuum was 0.05 inches of water at Well AI-9A, located 35 feet from the extraction well.
Stage 2 of the pilot study began on June 16, 1987. The vacuum blower produced a vacuum of approximately 9 inches of Hg at the extraction well head, and could be adjusted by a bleeder valve installed at the well head to control the vacuum and ultimately the air flow through the system. During Stage 2, the bleeder valve was fully open to allow ambient air to enter the extracted vapor flow. The resulting air flows were 175 scfm at the well head and 264 scfm through the bleeder valve. The vendor estimated that 60 percent of the total measured flow was through the bleeder valve, and therefore the remaining 40 percent was extracted from the unsaturated portion of the soil. The highest air velocity of 650 fpm from the primary inlet was recorded at Well AI-3U, 35 feet from the extraction well. The highest vacuum of 2.8 inches of water was recorded from Well AI-4L, during Stage 2.
Stage 3, which began on July 13, was structurally identical to Stage 2; however, the system operation differed. The bleeder valve was adjusted until the maximum design pressure for the blower was achieved. The vacuum measured at the well head during Stage 3 was approximately 14.5 inches of Hg, and the operating speed of the blower was set at 2500rpm. The highest air inlet velocity from a primary well was 750 fpm at Wells WCC-10A and AI-3U, and the highest vacuum from a primary well was measured at Well AI-4M. A measurable velocity was recorded at inlet Well 115A, which was 205 feet away from the extraction well. All the inlet wells in the peripheral well network exhibited small inlet velocities at some time during the Stage 3 testing. [11]
Procurement Process/Treatability Study Cost
No information regarding the procurement process or cost of the treatability study was included in the available documentation.
Treatablility Study Results
Operating Parameters and Performance Data
Table A-1 presents the operating parameters for each stage of the pilot-scale treatability study.
Table A-1. Operating Parameters for the Pilot-Scale Treatability Study [11]
| Test Parameter | Value (units) | ||
|---|---|---|---|
| Stage 1 | Stage 2 | Stage 3 | |
| Vacuum Applied | 25 inches Hg | 9 inches Hg | 14.5 inches Hg |
| Blower Speed (Stages 2 and 3 only) | - | 2500 rpm | 2500 rpm |
| Vacuum Measured at Well Head | 13.5 inches water | 12.5 inches Hg | 14.5 inches Hg |
| Air Flow Rate | 50 scfm | 500 scfm | 320 scfm |
Tables A-2 and A-3 present the results of the treatability study. Chemical
removal rates were estimated by measured flow rates and chemical concentrations
of contaminants in vapor extracted during the three stages.
Table A-2. Performance Data from the
Fairchild Semiconductor Site Pilot-Scale
Treatability Study [11]
| Parameter | Value | ||
|---|---|---|---|
| Stage 1 | Stage 2 | Stage 3 | |
| Total VOCs Removed | Not Available | Not Available | Not Available |
| Time of SVE System Operation* | Not Available | Not Available | Not Available |
| Chemical Removal Rate (Total) | 1.5-2.0 lbs/day | 7-12 lbs/day | 7-12 lbs/day |
| Removal Rates of Specific Contaminants | |||
| 1,1,1-Trichloroethane (TCA) | 1.25-1.75 lbs/day | Not Available | Not Available |
| 1,1-Dichloroethene (DCE) | 0.25 lbs/day | 4.2-7.2 lbs/day | 4.2-7.2 lbs/day |
| Acetone | No measured removal | No measured removal | No measured removal |
| Isopropyl alcohol (IPA) | No measured removal | No measured removal | No measured removal |
| Xylenes | Not Available | 0.84-2.4 lbs/day | 0.84-2.4 lbs/day |
*Treatability study report provides the start date for each stage, but does not indicate total hours or the end date of SVE system operation.
Table A-3. Soil Matrix Analysis Results from the Fairchild Semicondctor
Site
Treatability Study [11]
| Soil Boring Number* | Sample Depth (ft) | 1,1,1-TCA (mg/kg) | Xylene (mg/kg) | Acetone (mg/kg) | IPA (mg/kg) | Freon-113 (mg/kg) | 1,1-DCE (mg/kg) | PCE (mg/kg) | |
|---|---|---|---|---|---|---|---|---|---|
| AI-3/SB-222 | Pre-Test | 7.5-8.0 | ND | ND | ND | ND | ND | ND | ND |
| 18.5-19.0 | 0.12 | ND | ND | ND | 0.02 | 0.12 | ND | ||
| 34.5-35.0 | 0.09 | ND | ND | ND | ND | 0.03 | 0.02 | ||
| Post-Test | 18.7-19.0 | ND | ND | ND | ND | 0.02 | ND | ND | |
| 34.7-35.0 | ND | ND | ND | ND | ND | ND | ND | ||
| 47.0-47.3 | 0.03 | ND | ND | ND | 0.08 | ND | ND | ||
| AI-4/SB-225 | Pre-Test | 34.0-34.5 | 0.06 | ND | ND | ND | ND | 0.03 | 0.05 |
| 45.5-46.0 | 0.15 | ND | ND | ND | 0.05 | ND | ND | ||
| Post-Test | 12.7-13.0 | ND | ND | ND | ND | ND | ND | ND | |
| 34.0-34.3 | ND | ND | ND | ND | ND | ND | ND | ||
| 39.0-39.3 | ND | ND | ND | ND | ND | ND | ND | ||
| 45.3-45.7 | 0.05 | ND | ND | ND | ND | ND | ND | ||
| 54.0-54.3 | 0.02 | ND | ND | ND | ND | ND | ND | ||
| AI-8/SB-223 | Pre-Test | 21.5-22.0 | 0.03 | ND | ND | ND | ND | 0.08 | ND |
| 33.5-34.0 | 0.21 | ND | ND | ND | ND | 0.04 | ND | ||
| 47.0-47.5 | 0.31 | 3.3 | ND | ND | 0.1 | 0.18 | 0.07 | ||
| Post-Test | 21.7-22.0 | ND | ND | ND | ND | ND | ND | ND | |
| 26.7-27.0 | 0.02 | ND | ND | ND | ND | 0.75 | ND | ||
| 33.7-34.0 | ND | ND | ND | ND | ND | ND | ND | ||
| 42.0-42.3 | ND | ND | 950.00 | ND | ND | ND | ND | ||
| 47.0-47.3 | 0.16 | ND | ND | ND | ND | ND | ND | ||
| 54.3-54.7 | 27.0 | ND | ND | ND | ND | ND | ND | ||
| 69.0-69.3 | 0.11 | ND | ND | 0.12 | ND | ND | ND | ||
| SB-190/SB-224 | Pre-Test | 9.7-10.0 | ND | ND | ND | ND | ND | ND | ND |
| 19.7-20.0 | ND | ND | ND | ND | ND | ND | ND | ||
| 29.7-30.0 | ND | ND | ND | ND | ND | ND | ND | ||
| 39.4-39.7 | 3.7 | 1 7 | 18 | ND | ND | ND | ND | ||
| 41.4-41.7 | 1.3 | 5.2 | 6.8 | ND | ND | ND | ND | ||
| 44.7-45.0 | 2.3 | 6.7 | 16 | 10.00 | ND | ND | ND | ||
| 49.4-49.7 | 6 | 7.6 | 14 | 5.8 | ND | ND | ND | ||
| 69.4-69.7 | 2.2 | ND | ND | 4.1 | ND | ND | ND | ||
| Post-Test | 38.0-40.0 | 0.99 | 9.5 | 860 | 79 | ND | ND | ND | |
| 40.0-42.0 | 0.51 | 3.2 | 740 | 27 | ND | ND | ND | ||
| 44.0-46.0 | 0.85 | 3.5 | 1 7 | 14 | ND | ND | ND | ||
| 48.0-50.0 | 3.8 | 2.7 | 10 | 12 | ND | ND | ND | ||
| 68.0-70.0 | 40 | 22 | 6.9 | ND | ND | 0.76 | ND | ||
| SB-205/SB-228 | Pre-Test | 9.70-10.0 | ND | ND | ND | ND | ND | ND | ND |
| 19.7-20.0 | ND | ND | ND | ND | ND | ND | ND | ||
| 39.7-40.0 | 0.33 | 16 | 800 | 1400 | ND | ND | ND | ||
| 49.7-50.0 | ND | 3.6 | 22 | 17 | ND | ND | ND | ||
| 55.0-55.3 | 3.8 | 2.7 | 1.2 | 0.9 | ND | ND | ND | ||
| 59.7-60.0 | 19 | 3.8 | 3.3 | 5.4 | ND | 4.5 | ND | ||
| Post-Test | 39.7-40.0 | ND | 2.4 | 310 | ND | ND | ND | ND | |
| 55.0-55.3 | 2.8 | 1.8 | 3.1 | ND | ND | ND | ND | ||
| 59.7-60.0 | 303 | 204 | ND | ND | ND | ND | ND | ||
| SB-209/SB-221 | Pre-Test | 9.7-10.0 | ND | ND | ND | ND | ND | ND | ND |
| 19.7-20.0 | ND | ND | ND | ND | ND | ND | ND | ||
| 29.7-30.0 | 0.2 | ND | ND | ND | ND | ND | ND | ||
| 39.7-40.0 | 0.4 | 12 | 15 | 6.6 | ND | ND | ND | ||
| 49.7-50.0 | 0.79 | 5.4 | 13 | ND | ND | ND | ND | ||
| 59.7-60.0 | 8.7 | 5.4 | 2.8 | ND | ND | 1.3 | ND | ||
| 71.0-71.3 | 48 | 60 | ND | ND | ND | 1.6 | ND | ||
| Post-Test | 49.7-50.0 | 4 | 3.9 | 16 | 3.1 | ND | 0.4 | ND | |
| 55.0-55.3 | 14.1 | 14 | 3.6 | ND | ND | ND | ND | ||
| 59.7-60.0 | 29 | 16 | 1.9 | ND | ND | 1.9 | ND | ||
| SB-200/SB-226 | Pre-Test | 9.3-9.7 | ND | 0.36 | 8.7 | 6.1 | ND | ND | ND |
| 19.4-19.7 | ND | ND | ND | ND | ND | ND | ND | ||
| 29.4-29.7 | ND | ND | ND | ND | ND | ND | ND | ||
| 39.7-40.0 | 0.14 | 41.0 | 570 | 410 | ND | ND | ND | ||
| 49.7-50.0 | 1.7 | 4.6 | 9.7 | 3.8 | ND | 0.17 | ND | ||
| 55.30 | 13 | 3.7 | 9.4 | 2 | ND | 0.88 | ND | ||
| 58.0-58.3 | 50.00 | 6.30 | 12.00 | 6.90 | ND | 5.70 | ND | ||
| 63.0-63.3 | 280.00 | 500.00 | ND | ND | ND | 17.00 | 2.9 | ||
| 69.7-70.0 | 0.28 | 0.35 | ND | ND | ND | ND | ND | ||
| Post-Test | 38.0-40.0 | ND | 1.8 | 130 | ND | ND | ND | ND | |
| 44.0-46.0 | ND | 1.4 | ND | ND | ND | ND | ND | ||
| 48.0-50.0 | 0.52 | 2 | ND | ND | ND | ND | ND | ||
| 54.0-56.0 | 7.3 | 2.2 | 6.4 | ND | ND | 0.23 | ND | ||
| 58.0-60.0 | 35 | 13 | 15 | ND | ND | 2.80 | ND | ||
| 62.0-64.0 | 30 | 3.3 | ND | ND | ND | 3.20 | ND | ||
| 68.0-70.0 | 3.4 | 2.1 | 2 | ND | ND | 0.19 | ND | ||
| SB-219/SB-227 | Pre-Test | 20.5-21.0 | ND | ND | ND | ND | ND | ND | ND |
| 25.7-26.0 | 0.22 | ND | ND | ND | ND | ND | ND | ||
| 31.2-31.5 | 0.35 | ND | ND | ND | ND | ND | ND | ||
| 36.2-36.5 | 0.35 | 2.7 | 204.0 | 8.2 | ND | ND | ND | ||
| 41.2-41.5 | 0.44 | 2.2 | 650.0 | 1400.0 | ND | ND | ND | ||
| 45.7-46.0 | 2.7 | 14.0 | 180.0 | 260.0 | ND | 0.135 | ND | ||
| Post-Test | 47.7-48.0 | 2.4 | 12.0 | 460.0 | 330.0 | ND | 0.23 | ND | |
| 49.0-49.3 | 0.33 | 6.0 | 460.0 | 72.00 | ND | 0.22 | ND | ||
| 51.0-51.3 | 0.87 | 0.55 | 14.0 | ND | ND | ND | ND | ||
| 25.7-26.0 | ND | ND | ND | ND | ND | ND | ND | ||
| 31.0-31.3 | 0.47 | ND | ND | ND | ND | ND | ND | ||
| 36.7-37.0 | ND | ND | 170.0 | ND | ND | ND | ND | ||
| 46.0-46.3 | 0.45 | ND | 7.90 | ND | ND | ND | ND | ||
| 48.5-49.0 | 0.38 | 2.80 | 6.00 | ND | ND | ND | ND | ||
| 51.7-52.0 | 0.53 | ND | 4.90 | ND | ND | ND | ND |
ND=Not detected.
*First number is the pre-test soil boring, second number is the post-test soil
boring.
In addition, soil samples were taken during well installation to characterize
approximate top, intermediate, and bottom depths of the unsaturated aquifer and
after Stages 1 and 3. These samples were taken at locations and depths
corresponding to the sampling efforts during well installation. Air samples
were also collected from the air inlet well system prior to conducting the
treatability study, and following each stage of operation. [11]
Performance Data Assessment
The vendor identified the following with respect to performance of the SVE system during the treatability study:
Performance Data Completeness
Performance data completeness cannot currently be assessed because information on soil boring locations, contaminant removal over time, extracted soil vapor concentrations, and material balance data are not available at this time.
Performance Data Quality
According to the vendor, data collection and sample analysis was performed in accordance with QA/QC procedures described in the Site Sampling Plan, Quality Assurance/Quality Control Plan, and Site Safety Plan.
In addition, duplicate samples of extracted air vapors were collected using charcoal tubes and were analyzed at two laboratories. According to the vendor, analytical results from the two laboratories "compared favorably." The calculated relative mean difference indicated an analytical precision of 15 percent. An organic vapor analyzer (OVA) was used to monitor extracted air vapor VOC concentrations during the study. OVA readings were taken 4 to 5 times per day and generally indicated lower concentrations than those measured in the laboratory. The QA/QC procedures and complete analytical data were not included in the available documentation and could not be assessed at this time. [11]
Projected Full-Scale Cost
No projected full-scale costs were provided in the available documentation. However, the vendor noted the following observations that could impact the cost of full-scale treatment:
Observations and Lessons Learned
The following observations and lessons learned were noted by the vendor: