
|
Cost and Performance
Report:
|
Preparation of this report has been funded wholly or in part by the U.S. Environmental Protection Agency under Contract Number 68-W3-0001. It has been subject to administrative review by EPA headquarters and Regional staff and by the technology vendor. Mention of trade names for commercial products does not constitute endorsement or recommendation for use.
This report presents cost and performance data for a thermal desorption treatment application at the T H Agriculture & Nutrition (THAN) Company Superfund site in Albany, Georgia. Stockpiled soil contaminated with organochlorine (OCL) pesticides was treated as part of a removal action. This project is notable for being the first full-scale thermal desorption treatment application of soil containing a mixture of OCL pesticides at a Superfund site. In addition, an interlock process control system was used to monitor process parameters.
The THAN site, used from the 1950s to 1982 for pesticide formulation and storage, was placed on the National Priorities List (NPL) in 1989. In March 1992, EPA issued a Unilateral Administrative Order (UAO) to THAN for a soil and debris removal action at the site. An estimated 4,300 tons of soil with concentrations of total OCL pesticides equal to or greater than 1,000 mg/kg was excavated and stockpiled at the site. Initially, the stockpiled soil was to be transported to an off-site incinerator for treatment. However, because the actual volume of stockpiled soil was over four times the initial estimate of 1,000 tons, on-site thermal desorption, with subsequent placement of treated soils on-site, was used.
The UAO established a treatment goal of less than 100 mg/kg for total OCL pesticides in the treated subsurface soil. A Treatability Variance (TV), received in October 1992, allowed the treated soil to be placed on site after treatment and required a minimum reduction of 90% in concentration of specific OCL pesticides. Air emission limitations for the thermal desorber stack gas were established through negotiation with EPA.
The full-scale thermal desorption system operated from July to October 1993 and was used to treat approximately 4,300 tons of contaminated soil. Total OCL pesticide concentrations in the treated soil at THAN ranged from 0.009 to 4.2 mg/kg during the full-scale operation, with an average concentration of 0.5065 mg/kg. Average removal efficiencies achieved for the four target OCL pesticides were greater than 98 percent.
Prior to full-scale operation, a process shakedown and proof-of-process performance test were conducted to verify the effectiveness of the operating conditions. In addition, a shakedown pretest was conducted to evaluate the materials handling portion of the system.
Based on a petition for reimbursement, the cost for thermal desorption at THAN was approximately $1.1 million, including approximately $850,000 in costs directly attributed to treatment activities (corresponding to $200/ton of soil treated).
Table of Contents | Forward to Site Information
T H Agriculture & Nutrition Company Superfund Site
Albany, Georgia
Action Memorandum Date: Not Available
Type of Action: Removal
Treatability Study Associated with Application? Yes (see Appendix A)
EPA SITE Program Test Associated with Application? No
Operating Period: July to October 1994
Quantity of Soil Treated During Application: 4,318 tons
Historical Activity That Generated Contamination at the Site:
Agricultural Pesticides Formulation and Storage
Corresponding SIC Code: 2879 (Pesticides and Agricultural Chemicals, Not
Elsewhere Classified)
Waste Management Practices That Contributed to Contamination:
Manufacturing process
Site History: The 7-acre T H Agriculture &
Nutrition Company (THAN) facility is located in Albany, Georgia, as shown in
Figure 1. From the mid-1950s until 1967, the site was used by other companies
for the storage and formulation of pesticides. Typical activities for
formulating pesticides included preparation of dry and liquid formulations, and
blending pesticides with solvents. THAN purchased the site in 1967 and
continued pesticide formulation operations until 1978. The site was used by
THAN as a storage and distribution center until 1982. [3]
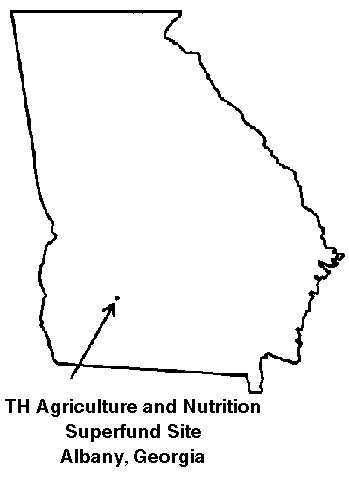
Figure 1. Site Location
In 1982, the Georgia Environmental Protection Division (GEPD) determined that the soil and groundwater at the site were contaminated primarily with OCL pesticides and solvents as a result of site activities. The site was placed on the National Priorities List (NPL) in March 1989. [3]
Regulatory Context: In response to a UAO issued by EPA in March 1992 for a soil and debris removal action, THAN excavated soil from areas where a 50 mg/kg concentration in surface soils and 100 mg/kg concentration in subsurface soils of total OCLs was exceeded. A total of 29,000 tons of contaminated soil and debris were excavated from these areas. Approximately 4,300 tons of excavated soil was stockpiled on site for further treatment. Initially the stockpiled soil was to be transported to an off-site incinerator for treatment. However, because the actual volume of stockpiled soil was over four times greater than the initial estimate of 1,000 tons, on-site thermal desorption, with subsequent placement of treated soils on-site, was used. The stockpiled soil was identified as containing listed hazardous wastes with RCRA waste codes P037 (dieldrin), P123 (toxaphene), U061 (DDT and metabolites), U129 (lindane), and U239 (xylenes). The remaining 24,700 tons were disposed off-site. [3]
A TV, received from EPA Region 4 on October 27, 1992, set treatment standards for on-site thermal desorption of the stockpiled soils and approved a plan to place and cover thermally treated soils on site with a minimum of 2 feet of clean soil. In addition, air emissions limits were established for the thermal desorber stack gas. [3]
Prior to approval of the full-scale remediation work plan, THAN was required to show proof-of-process in a performance test. A shakedown pretest was performed to evaluate the materials handling portion of the system. The proof-of-process performance test was run in July 1993. Based on the proof-of-process performance test results, EPA Region 4 provided the required approval to conduct full-scale treatment activities in August 1993. Full-scale treatment activities began in August 1993 and concluded in October 1993. Demobilization of the unit was completed in January 1994. [4, 8, 9]
Site Management: PRP Lead
Oversight: EPA
On-Scene Coordinator:
R. Donald Rigger
U.S. Environmental Protection Agency Region 4
345 Courtland Street, NE Atlanta, Georgia 30365
(404) 347-3931
Contractor:
Mark Fleri, Project Manager
Williams Environmental Services, Inc.
2076 West Park Place
Stone Mountain, Georgia 30087
(404) 498-2020
Project Oversight:
William L. Troxler, P.E.
Focus Environmental, Inc.
9050 Executive Park Drive, Suite A-202
Knoxville, Tennessee 37923
(615) 694-7517
Back to Executive Summary |
Table of Contents | Forward to Matrix Description
Type of Matrix Processed Through the Treatment System: Soil (ex situ)
Primary Contaminant Group: Halogenated Organic Pesticides
THAN conducted an RI between December 1990 and September 1991 including soil, groundwater, and other media sampling. Constituents identified at the site included organochlorine (OCL) pesticides, organophosphorus (OP) pesticides, polychlorinated biphenyls (PCBs), chlorinated herbicides (CHs), volatile and semivolatile organics, as well as inorganics. [3] The OCL pesticide constituents were analyzed using EPA Method 8080.
Listed below in Table 1 are the major matrix characteristics affecting cost or performance, and the values measured for each.
Table 1. Matrix Characteristics [13]
| Parameter | Value | Measurement Method |
|---|---|---|
| Soil Classification | Not Provided | -- |
| Clay Content and/or Particle Size Distribution | See Table 2 | -- |
| Bulk Density | 125.8 to 129.7 lbs/ft3 | Not Available |
| Lower Explosive Limit | Not Available | -- |
| Moisture Content | 13 to 19% | ASTM D2216 |
| pH | 5.7 to 6.2 | ASA #9 |
| Total Organic Carbon (TOC) | 0.2 to 0.23% | Not Available |
| Oil and Grease or Total Petroleum Hydrocarbons | Not Available | -- |
Specific particle size distribution data were measured for the stockpiled soil
and are provided below in Table 2. The soil was described as containing large
clumps of clay. The impact of high clay content material on the system
operation is discussed in the Thermal Desorption System Description and
Operation section of this report.
Table 2. Particle Size Distribution of Stockpiled Soil [13]
| Particle Size (millimeters) | Distribution (percent) |
|---|---|
| 0 - 0.074 | 0.8 - 1.2 |
| 0.074 - 0.149 | 5.6 - 8.0 |
| 0.149 - 0.297 | 18.4 - 20.4 |
| 0.297 - 0.590 | 21.2 - 22.0 |
| 0.590 - 1.19 | 12.2 - 12.4 |
| 1.19 - 2.38 | 36.8 - 41.0 |
Back to Site Information | Table of Contents | Forward to Treatment System Description
Thermal Desorption
Pretreatment (Solids): Screening
Post-Treatment (Air): Baghouse, Quench, Air Cooler, Induced Draft Fan, Carbon Adsorption, Condenser
Post-Treatment (Solids): Quench
Post-Treatment (Water): Carbon Adsorption
The Williams Environmental Services, Inc. Thermal Desorption
Processing Unit (TPU) #1, used to treat soils at the THAN site and shown in
Figure 2, consisted of a feed system, a countercurrent rotary desorber, and a
cooling system for the treated soil. Off-gasses were routed through a baghouse,
a water quenching unit, a reheater, and a vapor phase carbon adsorption bed, as
shown in Figure 2. Quench water was routed through a liquid-phase carbon
adsorption bed. Treated solids from the system were mixed with baghouse fines
and redeposited on site. Off-gases were vented to the atmosphere through a
stack, after treatment in the air pollution control (APC) unit. The activated
carbon beds were regenerated off site.
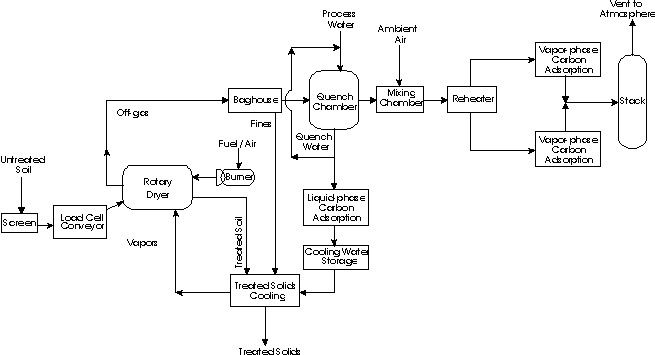 Figure 2. Williams
Environmental Services, Inc.
Figure 2. Williams
Environmental Services, Inc.
Thermal Desorption Unit, TPU #1 Used at THAN Facility, Albany, Georgia
[8]
An interlock process control system was utilized to maintain operation of the TPU #1 system within allowable limits. In the event that any of the limits were breached, the interlock system was designed to automatically shut down the feed system. Parameters monitored on either an instantaneous or rolling average included the elements listed in the following table. Cutoff conditions for the interlock system are also shown below on Table 3.
Table 3. Interlock System Cutoff Conditions [9]
| Interlock System Process Parameter | Cutoff Condition | Type of Monitoring and/or Cutoff |
|---|---|---|
| Minimum Desorber Exit Gas Temperature | 250ºF | 1-minute time delay |
| Maximum Desorber Exit Gas Temperature | 510ºF | Instantaneous, vent opens, automatic waste feed shutoff |
| Maximum Soil Feed Rate | 7.8 tons/hour | 20-minute rolling average |
| Minimum Treated Soil Exit Temperature | 875ºF | 20-minute delay |
| Minimum Quench Recycle Liquid Pressure | 5 psi | 5-minute time delay |
| Maximum Quench Exit Gas Temperature | 200ºF | Instantaneous, vent opens, automatic waste feed shutoff |
| Minimum Baghouse Differential Pressure | 1-inch water column | Instantaneous |
| Power Failure | -- | Instantaneous, vent opens |
| Maximum Stack Gas Total Hydrocarbons | 100 ppmv | 20-minute rolling average |
A process change was made prior to full-scale treatment activities based on automatic cutoffs during the proof-of-process performance test. Insufficient fan capacity triggered several cutoffs based on the maximum rotary dryer pressure of 0.00 inches of water; the fan was replaced prior to conducting full-scale treatment activities.
The TPU #1 feed system consisted of a shaker screen, a conveyor belt, and an automated load cell that was connected to the interlock system. The shaker screen removed clay clumps and other material greater than 3/4 inch in size from the soil stockpile. These clay clumps were crushed using a front-end loader and re-introduced into the desorber.
The TPU #1 soil treatment unit consisted of a countercurrent flow rotary dryer, a propane-fired burner unit, a primary mover unit, and a soil quench system. The desorber was a direct-fired, rotating, inclined cylindrical drum 5 feet in diameter and 22 feet in length, and was constructed from a combination of carbon steel and stainless steel. The primary burner was rated at 21,000,000 Btu/hr and fired with propane in air. A centrifugal fan maintained a negative pressure through the desorber with an average flow of 15,056 actual cubic feet per minute (acfm). The burner gas enhanced the volatilization and transport of organic contaminants from the soil. Desorption was enhanced by the drum’s rotation as well as internal flights that lifted and spilled soils in the heated regime of the dryer. Actual soil exit temperatures during the performance test were measured between 833 and 1,085°F. Treated soils exited at the burner end of the unit via a screw conveyor where they were mixed with fines from the baghouse and quenched with process water to suppress dust emissions. A negative pressure was maintained throughout the transport system to capture vapors from the quenching process. The screw conveyor discharged the treated solids to a stacking conveyor for stockpiling. The treated soil was deposited on site.
The TPU #1 exhaust gas treatment system consisted of a baghouse, a quench chamber, a mixing chamber, a reheater, an induced draft fan, and a vapor-phase carbon adsorption system. The off-gases were fed into a pulse jet baghouse, which consisted of an enclosed series of fine-mesh cloth filters to remove particulates. The baghouse operated at temperatures up to 500°F and a maximum air-to-cloth ratio of 5:1. The baghouse fines were discharged from the hoppers via a conveyor system to the treated soils transport unit. The baghouse off-gases were then quenched by flash evaporation of water in a quench chamber, which cooled the gas to the adiabatic saturation temperature of 165°F. The exhaust gas from the quench unit was passed through a demister, and then cooled to 140°F by mixing with ambient air. To control potential condensation, the gases were then reheated to 150°F and fed through a parallel dual-bed (12,000 pounds per bed) carbon adsorption system. The treated off-gases were then vented to the atmosphere through a 45 foot vertical stack.
A portion of the quench water was recycled back to the spray nozzles in the spray tower at a rate of approximately 30 gpm. This recycle was monitored for pH and for the presence of acid gases. Caustic soda (50% NaOH) was added when neutralization was necessary. The remaining quench water was treated with a liquid-phase carbon adsorption system and then stored for use in cooling treated soils. Both the liquid- and vapor-phase carbon adsorption beds were regenerated off site at Westates Carbon in Parker, Arizona.
Prior to full-scale system operation, a shakedown pretest and proof-of-process performance test were conducted using 268 tons of the stockpiled soil. The shakedown pretest was used to evaluate the materials handling portion of the system. During the pretest, large clumps of clay were found in the soil stockpile, and were identified as a potential problem for obtaining good heat transfer in the desorber. A shaker screen was added to the system to limit materials to 3/4 inch in size prior to the proof-of performance test. [8]
The proof-of-process performance test was conducted at the THAN facility on July 22, 23, and 25, 1993. Four runs were conducted on approximately 152 tons of the stockpiled soils to demonstrate that the soil could be treated to the target levels while not exceeding air emissions set for the remediation. On average, the soil feed rate was 8.3 tons per hour, soil temperature was 1,000°F, and the exhaust temperature was 319°F. The results indicated that all treated soil target levels could be met while not exceeding the air standards.
Full-scale treatment activities at the THAN facility began on August 12, 1993, and continued until October 1993. Sampling and analysis of soils beneath the stockpile area and in the area around the thermal desorption system occurred after the full-scale treatment was completed to verify that all soils on site above EPA's action levels had been treated.
The treated soils were placed on site as was stipulated in the treatability variance. Personal protective equipment, debris, and construction waste were landfilled at a Chemical Waste Management facility in Carlyss, Louisiana. Demobilization of the unit was completed in January 1994.
Listed below in Table 4 are the major operating parameters affecting cost or performance for thermal desorption and the values measured for each during this treatment application.
Table 4. Operating Parameters [8, 10]
| Parameter | Value |
|---|---|
| Stack Gas Air Flow Rate | 15,056 acfm (average) |
| Heating Chamber Maximum Operating Pressure | 0.0 inches water column |
| Soil Residence Time per Pass | 15 minutes |
| Number of Passes | 1 |
| System Throughput | 7.29 to 9.5 tons/hour |
| Temperature of Soil Exiting Heating Chamber | 833 to 1,080ºF |
| Heating Chamber Exhaust Gas Temperature | 284 to 332ºF |
| Baghouse Differential Pressure | 1.8 to 2.2 inches water column |
| Maximum Quench Exhaust Temperature | 200ºF |
| Minimum Quench Recycle Liquid Pressure | 5 psig |
| Carbon Adsorption Inlet Gas Temperature | 141 to 150ºF |
| Minimum APC System Purge Rate | 1 gpm |
| Minimum APC System Water Supply Pressure | 20 psig |
A timeline for this application is shown in Table 5.
Table 5. Timeline [8]
| Start Date | End Date | Activity |
|---|---|---|
| Mid-1950s | 1982 | Pesticide formulating and storage operations conducted at site. |
| October 1982 | 1989 | GEPD conducted initial site visits and identified soil and groundwater contamination. THAN conducted studies to evaluate the nature and extent of contamination. |
| July 1984 | September 1984 | Removed and disposed of 10,400 tons of soil and debris at a hazardous waste landfill. |
| March 1989 | -- | THAN placed on National Priorities List. |
| March 1992 | -- | EPA issed a Unilateral Administrative Order for removal action. |
| April 1992 | -- | Disposal of 24,700 tons of soil and debris at a hazardous waste landfill. |
| June 1992 | -- | Bench-scale treatability study for thermal desorption. |
| October 1992 | -- | Treatability Variance granted. |
| July 1993 | -- | Full-scale Proof-of-Process Performance Test. |
| August 1993 | October 1993 | Full-scale treatment activity. |
| January 1994 | -- | Demobilization completed. |
Back to Matrix Description | Table of Contents | Forward to Treatment System Performance
Cleanup goals for the thermal desorption application at THAN were identified in a March 1992 UAO. An October 1992 TV provided additional treatment requirements for the soil, and negotiations with EPA established air emission standards for the project. The treatment requirements for both the proof-of-process performance test and full-scale treatment activities are shown below in Table 6. [9, 11, 12] The constituents included in the parameter "Total OCL Pesticides" include aldrin, alpha-BHC, beta-BHC, delta-BHC, lindane, chlordane, DDT, DDD, DDE, dieldrin, endosulfan I, endosulfan II, endrin, and toxaphene. [3]
Table 6. Treatment Requirements [9, 11, 12]
| Constituent/Parameter | Soil Cleanup Goal | Source | Required During Proof-of-Performance Test | Required During Full-Scale Treatment Activity |
|---|---|---|---|---|
| 4,4'-DDT | >90% measured reduction in concentration | Treatability Variance | x | x |
| Toxaphene | >90% measured reduction in concentration | Treatability Variance | x | x |
| BHC-alpha | >90% measured reduction in concentration | Treatability Variance | x | x |
| BHC-beta | >90% measured reduction in concentration | Treatability Variance | x | x |
| Total OCL Pesticides | <100 mg/kg | Unilateral Administrative Order and Treatability Variance | x | x |
Air emission standards for stack gas THC, HCl, and particulates were
established in negotiations with EPA, as shown in Table 7.
Table 7. Air Emission Standards [8]
| Constituent/Parameter | Air Emission Standards | Source | Required During Proof-of-Performance Test | Required During Full-Scale Treatment Activity |
|---|---|---|---|---|
| Stack Gas Total Hydrocarbons | 100 ppmv | Negotiations with EPA | x | x (operating parameter) |
| HCl Mass Emission Rate | <4 lbs/hr | Negotiations with EPA | x | |
| Stack Gas Particulates | <0.08 gr/dscf | Negotiations with EPA | x | |
| Toxaphene | As shown on Figure 3 | Georgia Guideline for Ambient Impact Assessment of Toxic Air Pollutant Emissions | x | |
| 4,4'-DDT | As shown on Figure 4 | Georgia Guideline for Ambient Impact Assessment of Toxic Air Pollutant Emissions | x |
Soil cleanup goals were developed in two stages. A goal of 100 mg/kg for total OCL pesticides on a dry-weight basis was first provided in the UAO. Additional goals for measured reductions in concentration of target constituents were then developed for a TV based on Superfund LDR Guide #6B - Obtaining a Soil and Debris Treatability Variance for Removal Actions (Directive 9347.3-06BFS). Soil cleanup goals required to be demonstrated during the proof-of-process performance test and full-scale treatability activity included a minimum reduction of 90% in concentration of BHC (alpha and beta), 4,4'-DDT, and toxaphene; and less than 100 mg/kg total OCL pesticides in the treated soil. Since the stockpile had been characterized and 90% reduction had been achieved during the performance test, no feed samples were required for collection or analysis during the full-scale operation, provided that the system operated within the proposed operating conditions agreed upon by THAN and EPA.
Air emission standards were developed through negotiations with EPA. Stack gas particulates and HCl emission rate limits were based on requirements in 40 CFR Part 264.343 (which provides standards for incinerator emissions). A THC emission limit of 100 ppmv based on a 60-minute rolling average was developed by EPA using the following assumptions:
1. Feed soil containing approximately 1% total organic material, such as humic materials;
2. A stack gas flow rate of 56,420 lbs/hr (dry basis), or 1,947 mols/hr; and
3. The APC system achieving a removal efficiency of between 93% and 96% for non-methane hydrocarbons.
Air emissions standards for toxaphene and DDT were developed
based on compliance with Georgia’s Guidelines for Ambient Impact
Assessment of Toxic Air Pollutant Emissions. The attached graphs (Figures 3 and
4) showing acceptable ambient concentrations for toxaphene and DDT were
developed based on site-specific air emission modeling conducted at the THAN
site. The concentrations shown on the graphs are a function of THAN’s
operating schedule and air pollution control equipment removal efficiency. For
example, at the maximum operating schedule of 24 hours per day, 7 days per
week, the required removal efficiency shown on Figure 3 for toxaphene is
96 percent.
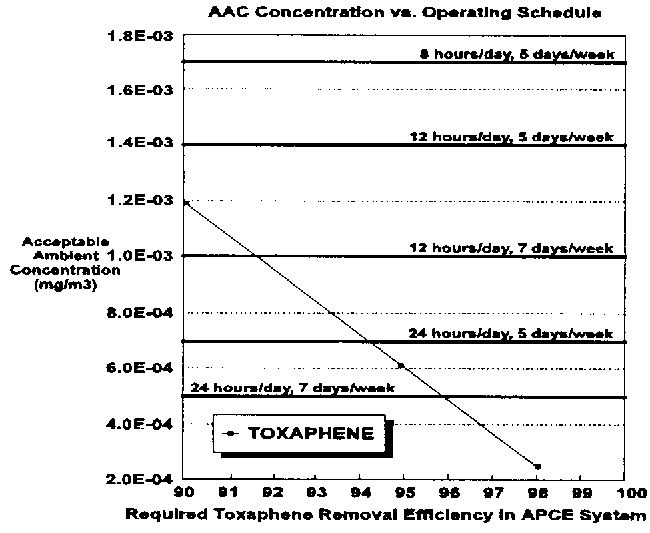
Figure 3. Toxaphene AAC Values vs. Operating Schedule
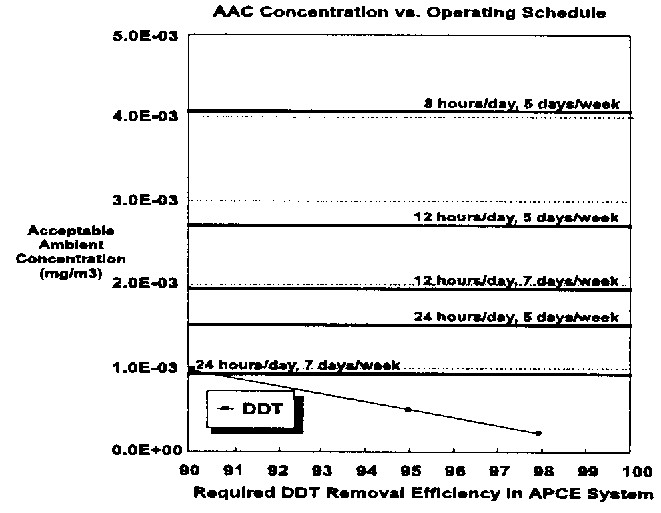
Figure 4. DDT AAC Values vs. Operating Schedule
Performance data for the thermal desorption treatment application at THAN include proof-of-process performance test data results and full-scale treatment activity data results. These data are presented in the following tables.
Soil data were obtained during the proof-of-process performance test by collecting process samples of untreated and treated soil. One composite sample was collected per run, consisting of grab samples collected at approximately 15-minute intervals during treatment operations. The samples were collected using procedures in EPA SW-846, "Test Methods for Evaluating Solid Waste, Physical/Chemical Methods." Each composite sample was analyzed using EPA Method 8080 for OCL pesticides.
Data presented in Table 8 represent the averages of the four composite samples collected during the four runs conducted during proof-of-process performance test.
Table 8. Proof-of-Process Performance Test Soil Data [8]
| Constituent/Parameter | Cleanup Goal | Average Untreated Soil Concentration (mg/kg) | Average Treated Soil Concentration(b) (mg/kg) | Range of Percent Removal (%) | Average Percent Removal (%)(c) |
|---|---|---|---|---|---|
| Aldrin | N/A | Not available(a) | <0.017 | Not available | >98.64 |
| BHC-alpha | >90% measured reduction in concentration | 1.9 | <0.017 | >92.6 to >99.7 | 97.84 |
| BHC-beta | >90% measured reduction in concentration | 4.5 | <0.017 | >92.4 to 99.81 | 97.89 |
| BHC-delta | N/A | Not available(a) | <0.017 | Not available | >98.28 |
| Lindane (BHC-gamma) | N/A | Not available(a) | <0.017 | Not available | >98.50 |
| Chlordane-alpha | N/A | Not available(a) | <0.017 | Not available | >98.50 |
| Chlordane-gamma | N/A | Not available(a) | <0.017 | Not available | >98.50 |
| Dieldrin | N/A | Not available(a) | <0.033 | Not available | >98.34 |
| 4,4'-DDD | N/A | Not available(a) | <0.033 | Not available | >98.50 |
| 4,4'-DDE | N/A | 9.48 | 2.94 | 0.0 to 98.98(d) | Not available(d) |
| 4,4'-DDT | >90% measured reduction in concentration | 212.6 | <0.017 | >99.6 to >99.99 | 99.89 |
| Endosulfan | N/A | 9.33 | <0.033 | Not available | >99.65 |
| Endosulfan II | N/A | Not available(a) | <0.017 | Not available | >98.64 |
| Endrin | N/A | Not available(a) | <0.033 | Not available | >98.64 |
| Toxaphene | >90% measured reduction in concentration | 257.7 | <1.70 | >97.0 to 99.72 | 98.98 |
| Total OCL Pesticides | <100 mg/kg | Not available | 4.01 | Not available | Not available |
N/A=Not Applicable.
(a)An average of the four proof-of process samples was not calculated because
one or more of the constituents was "not detected" in the untreated
soil sample.
(b)Concentrations repredent the average value of treated soil composite
samples.
(c)Average of the four percent removals calculated for each sample collected
during four proof-of-performance test runs.
(d)Analytical results indicated that 4'4-DDE concentration increased in Run #3.
Therefore, the percent removal shown as 0.0%for Run #3, and an average percent
removal was not calculated.
Air emissions data for stack gas OCL pesticides from the proof-of-process performance test were obtained through sampling activities conducted using EPA’s Modified Method 5 Sampling Train. Stack gas particulates and HCl were measured using EPA’s Method 5 Sampling Train, and stack gas total hydrocarbon concentrations were monitored with a continuous emission monitoring (CEM) system using EPA Method 25A. Data were collected during each of the four runs from the proof-of-process performance test, and are presented in Table 9.
Table 9. Proof-of-Process Performance Test Air Emissions Data [8, 14]
| Constituent/Parameter | Air Emission Standard | Average Emission Rate or Concentration | Range of Emission Rates or Concentrations |
|---|---|---|---|
| Stack Gas Total Hydrocarbons | 100 ppmv | 11.9 ppmv | 2.9 to 35.5 ppmv |
| HCl Mass Emission Rate | <4 lbs/hr | 0.12 lbs/hr | 0.12 to 0.13 lbs/hr |
| Stack Gas Particulates | <0.08 gr/dscf | 0.0006 gr/dscf | 0.0005 to 0.0007 gr/dscf |
| Toxaphene(a) | 1.48 µg/m3 | 0.045 µg/m3 | Not available |
| 4,4'-DDT(a) | 2.96 µg/m3 | ND | Not available |
ND=Not Detected.
(a)Allowable Ambient Air Concentrations were developed based on Georgia's
Guidelines for Ambient Impact Assessment of Toxic Air Pollutant Emissions.
Stack emissions calculated from the measured ambient concentrations of
toxaphene and 4'4-DDT were all ND.
Soil data were obtained during the full-scale treatment
activities by collecting and compositing samples of treated soils and are
presented in Table 10. A total of 18 composite samples were collected and
analyzed for OCL pesticides using EPA Method 8080.
Table 10. Full-Scale Treatment Activity Soil Performance Data [8]
| Constituent/Parameter | Soil Cleanup Goal | Average Untreated Soil Concentration(a) (mg/kg) | Average Treated Soil Concentration (mg/kg) | Range of Percent Removal (%)(c) | Average Percent Removal (%)(c) |
|---|---|---|---|---|---|
| Aldrin | N/A | Not available(b) | <0.0365 | Not available | Not available |
| BHC-alpha | 90% measured reduction in concentration | 1.9 | <0.0399 | >91.19 to >99.96 | >98.97 |
| BHC-beta | 90% measured reduction in concentration | 4.5 | <0.0383 | >96.22 to >99.98 | >99.57 |
| BHC-delta | N/A | Not available(b) | <0.0376 | Not available | Not available |
| Lindane (BHC-gamma) | N/A | Not available(b) | <0.0365 | Not available | Not available |
| Chlordane-alpha | N/A | Not available(b) | <0.0365 | Not available | Not available |
| Chlordane-gamma | N/A | Not available(b) | <0.0365 | Not available | Not available |
| Dieldrin | N/A | Not available (b) | <0.0703 | Not available | Not available |
| 4,4'-DDD | N/A | Not available(b) | <0.0703 | Not available | Not available |
| 4,4'-DDE | N/A | 9.48 | <0.4413 | Not available | >97.67 |
| 4,4'-DDT | 90% measured reduction in concentration | 212.6 | <0.0710 | >99.85 to >99.99 | >99.98 |
| Endosulfan | N/A | 9.33 | <0.0365 | Not available | >99.80 |
| Endosulfan II | N/A | Not available(b) | <0.0703 | Not available | Not available |
| Endrin | N/A | Not available(b) | <0.0703 | Not available | Not available |
| Toxaphene | 90% measured reduction in concentration | 257.7 | <3.6456 | >93.40 to >99.97 | >99.29 |
| Total OCL Pesticides | <100 mg/kg | Not available | 0.5065 | Not available | Not available |
N/A=Not Applicable
(a)Untreated soil concentrations shown were measured during the
proof-of-process performance test (see Table 8), because sampling and analysis
of untreated soil was not required during full-scale treatment activities.
(b)An average of the four proof-of-process performance test samples was not
provided because one or more of the concentrations was "not
detected."
(c)Percent removal calculations used one-half (0.5) of the detection limit.
Data use for these calculations are presented in Appendix B.
Average untreated soil concentrations presented in Table 10 are values from the proof-of-process performance test. Sampling and analysis of untreated soil was not required during full-scale treatment activities, as specified in EPA’s letter of approval following the proof-of-process performance test. Treated soil concentrations shown in Table 3 represent the average concentration of the 18 samples collected. Average percent removal was calculated by averaging the 18 separate values for percent removal of that constituent. The average treated soil concentration of total OCL pesticides of 0.5065 mg/kg represents the average of concentrations that ranged from 0.009 mg/kg to 4.2 mg/kg.
A complete data set for the 18 samples collected and analyzed during the full-scale treatment activity is provided in Appendix B.
Air emissions data, other than monitoring of THC in stack gas, were not required to be collected during the full-scale treatment activities. Because THAN met the treatment and emission standards during the proof-of-process performance test, EPA was satisfied that the established operating parameters would ensure attainment of the additional air emission goals during full-scale treatment activities.
The cleanup goal of 100 mg/kg total OCL pesticides in treated soils at the THAN site was achieved by the thermal desorption system. The average total OCL pesticides concentration in the treated soil was 0.5065 mg/kg during the full-scale treatment activities.
Average removal efficiencies measured during full-scale treatment activities of the thermal desorption system (averaged from 18 composite sample results) were greater than 98.97% for BHC-alpha, 99.57% for BHC-beta, 99.98% for 4,4'-DDT, and 99.29% for toxaphene. The individual sample removal efficiencies ranged from 91.19% to 99.99%. The treatment goal of 90% reduction of concentration established in the TV was achieved for the specified constituents.
The proof-of-process performance test results indicated that air emissions from the thermal desorption system achieved the air emission standards for particulate concentrations and HCl emission rates, Acceptable Ambient Concentrations for 4,4'-DDT and toxaphene developed from Georgia’s Air Toxics Guidelines, and EPA-approved THC concentrations in the stack gas.
Performance data available from the thermal desorption treatment application at the THAN facility include soil performance test data from the proof-of-process performance test and the full-scale treatment activities, and air emissions data from the proof-of-process performance test. These data characterize the treated soil matrix for OCL pesticides from the full-scale treatment activities. In the proof-of-process performance test, constituent concentrations for OCL pesticides in untreated soil are matched with treated soil concentrations, and linked to specific operating conditions.
All samples were analyzed using EPA-approved methods and data validation procedures. A QA/QC review was performed by Woodward-Clyde consultants for THAN and by Roy F. Weston, Inc for EPA. The results of this review indicated no technical data quality concerns. One deviation from EPA Method 8080 was noted; a wide-bore GC column was used instead of a packed GC column.
A single-point calibration was first conducted on toxaphene but was then reported with good agreement for a five-point calibration.
Back to Treatment System Description | Table of Contents | Forward to Treatment System Cost
Eight vendors were contacted by THAN regarding the thermal desorption project. THAN evaluated the cost estimates provided by each vendor for mobilization/demobilization and per ton treatment, and also evaluated the vendor's treatability study experience, the vendor's experience treating hazardous waste (rather than petroleum contamination), vendor availability, equipment types, and anticipated processing rates. Based on this assessment, THAN contracted with Williams Environmental and prepared the detailed work plans for the project.
Treatment system costs were obtained from a Petition for Reimbursement submitted by THAN to EPA, as shown below in Tables 11 and 12. In order to standardize reporting of costs across projects, costs are shown in Tables 11 and 12 according to the format for an interagency Work Breakdown Structure (WBS). No costs were reported for the following elements in the WBS: liquid preparation and handling; training; cost of ownership; dismantling; site work; surface water collection and control; groundwater collection and control; air pollution/gas collection and control; solids collection and containment; liquids/sediments/ sludges collection and containment; drums/tanks/structures/miscellaneous demolition and removal; decontamination and decommissioning; disposal (other than commercial); disposal (commercial); site restoration; or demobilization (other than treatment unit).
Table 11. Treatment Cost Elements [15]
| Cost Elements (Directly Associated with Treatment) | Cost (dollars) | Actual or Estimated ((A) or (E))* |
|---|---|---|
| Solids Preparation and Handling (equipment retrofit) | 30,000 | E |
| Vapor/Gas Preparation and Handling (equipment purchase, puffs) | 4,885 | E |
| Pads/Foundations/Spill Control (asphalt pad) | 26,373 | E |
| Mobilization/Set Up (mobilization) | 50,000 | E |
| Startup/Testing/Permits (performance test) | 30,000 | E |
| Operation (short-term; up to 3 years) (soil processing, air monitoring services, thermal treatment oversight, final report) | 698,738 | E |
| Demobilization (demobilization) | 10,000 | E |
| TOTAL TREATMENT COST | 849,996 | E |
Average Cost per Ton: $849,996/4,318 tons=$200/ton of
soil treated
*Cost data were submitted by THAN in a Petition for Reimbursement, and have not
been evaluated by EPA as of June 15, 1994.
Table 12. Before-Treatment Cost Elements [15]
| Cost Elements | Cost (dollars) | Actual or Estimated ((A) or (E))* |
|---|---|---|
| Mobilization and Preparatory Work (Focus' and Williams' work plan preparation, modeling) | 148,263 | E |
| Monitoring, Sampling, Testing, and Analysis (treatability study; Enseco engineering; untreated soil, treated soil, process water analyses, and puff air sample analyses; and respirable dust analyses) | 104,319 | E |
*Cost data were submitted by THAN in a Petition for
Reimbursement, and have not been evaluated by EPA as of June 15, 1994.
An assessment of cost data quality has not been completed to
date. Cost data were submitted by THAN in a Petition for Reimbursement, and
have not been evaluated by EPA Region 4 as of June 15, 1994.
Back to Treatment System Performance | Table of Contents | Forward to Observations and Lessons Learned
Back to Treatment System Cost | Table of Contents | Forward to References
This case study was prepared for the U.S. Environmental Protection Agency's Office of Solid Waste and Emergency Response, Technology Innovation Office. Assistance was provided by Radian Corporation under EPA Contract No. 68-W3-0001.
Back to Observations and Lessons Learned | Table of Contents | Forward to Appendix A - Treatability Study Results
Treatability Study Objectives
Treatability Study Duration: 6/11/92 to 6/12/92
The purpose of the bench-scale treatability test was to determine the feasibility of treating OCL pesticide-contaminated soils from the THAN site using thermal desorption (i.e., achieving greater than 90% removal) and to evaluate the effects of varying temperature and residence time on pesticide removal efficiency to determine optimum operating range.
Treatability Study Test Description
The test was conducted by Williams Environmental Services at Deep South Laboratories in Homewood, Alabama. Contaminated soils from the THAN site (100 grams per batch) were treated in static trays at various residence times and temperatures. The trays were shallow pans. The pans were placed in a muffle furnace with nitrogen used as a purge gas to eliminate organic vapor saturation in the furnace. Fifteen OCL pesticides and two OP pesticides were targeted for analysis in determining the treatment removal effectiveness of thermal desorption using soils from the THAN site.
The ranges selected for the operating parameters used were
based on known operating parameter limits of the rotary dryer and the physical
characteristics (boiling point and volatility) of the OCL pesticides present in
the THAN site soils. The following temperatures were tested: 500°F,
700°F, and 900°F. An initial temperature of 212°F was used to
simulate the entrance of the soil into the rotary dryer, where the water in the
soils are first vaporized. The temperature was then increased at a rate
equivalent to the temperature gradient present in the rotary dryer. Residence
times of 36 and 51 minutes were selected on the basis of the rotary
dryer’s normal operating range of 15 to 45 minutes.
| Test Temperature (ºF) | Pesticide Removal Efficiency (%) |
|
|---|---|---|
| 36-Minute Residence Time(a) | 51-Minute Residence Time(a) | |
| 500 | >86.85 | >90.28 |
| 700 | >99.89 | >99.90 |
| 900 | >99.91 | >99.91 |
(a)Residence time at target soil treatment temperature was six minutes for both scenarios. [8, 9]
Treatability Study Performance Data
At a residence time of 36 minutes, pesticide removal efficiencies were greater than 99% at 700°F and 900°F. At 500°F, the pesticide removal efficiency was less than 90%. However, at a residence time of 51 minutes, pesticide removal efficiencies greater than 90% were achieved at all three test temperatures. Removal efficiencies were greater than 99% at 700°F and 900°F and greater than 90% at 500°F. At a temperature of 500°F, concentrations of 4,4'-DDE were greater in the post-treatment soils than in the pre-treatment soils. The vendor attributed this increase to thermal decomposition of 4,4'-DDT. It was determined that at the higher temperatures this additional decomposition product was removed as well.
Treatability Study Lessons Learned
The treatability test showed that thermal desorption was feasible for treatment of pesticide-contaminated soils at the THAN site. These results were further validated in the full-scale remediation where the cleanup goals were met using thermal desorption.
Back to References | Table of Contents | Forward to Appendix B - Full-Scale Treatment Activity Soil Data
Appendix B - Full-Scale Treatment Activity Soil Data [8]
| Sample ID | aldrin (ug/kg) | alpha BHC (ug/kg) | beta BHC (ug/kg) | delta BHC (ug/kg) | gamma BHC (ug/kg) | alpha Chlordane(ug/kg) | gamma Chlordane(ug/kg) | 4'4' DDD (ug/kg) | 4'4' DDE (ug/kg) | 4'4' DDT (ug/kg) | Dieldrin (ug/kg) | Endo- sulfan I (ug/kg) | Endo- sulfan II (ug/kg) | Endrin (ug/kg) | Toxa- phene (ug/kg) | Total(a) OCL Pesticides (ug/kg) |
|---|---|---|---|---|---|---|---|---|---|---|---|---|---|---|---|---|
| 816-TS-P | <6.8 | <6.8 | <6.8 | <6.8 | <6.8 | <6.8 | <6.8 | <13 | 70 | <13 | <13 | <6.8 | <13 | <13 | <680 | 70 |
| 817-TS-P | <6.8 | <6.8 | <6.8 | <6.8 | <6.8 | <6.8 | <6.8 | <13 | 53 | <13 | <13 | <6.8 | <13 | <13 | <680 | 53 |
| 819-TS-P | <1.7 | <1.7 | <1.7 | <1.7 | <1.7 | <1.7 | <1.7 | <3.3 | <3.3 | <3.3 | <3.3 | <1.7 | <3.3 | <3.3 | <170 | ND |
| 829-TS-P-1 | <6.8 | <6.8 | 13 | <6.8 | <6.8 | <6.8 | <6.8 | <13 | 600 | 27 | <13 | <6.8 | <13 | <13 | <680 | 640 |
| 830-TS-P | <34 | <34 | <34 | <34 | <34 | <34 | <34 | <66 | 260 | <66 | <66 | <34 | <66 | <66 | <3400 | 260 |
| 902-TS-P-1 | <6.8 | <68 | 30 | <6.8 | <6.8 | <6.8 | <6.8 | <13 | 490 | 19 | <13 | <6.8 | <13 | <13 | <680 | 1010 |
| 906-TS-P-1 | <68 | <68 | <68 | <68 | <68 | <68 | <68 | <130 | 820 | <130 | <130 | <68 | <130 | <130 | <6800 | 820 |
| 909-TS-P-1 | <68 | <68 | <68 | <68 | <68 | <68 | <68 | <130 | 480 | <130 | <130 | <68 | <130 | <130 | <6800 | 480 |
| 911-TS-P-1 | <8.5 | <8.5 | <8.5 | <8.5 | <8.5 | <8.5 | <8.5 | <16 | 57 | <16 | <16 | <8.5 | <16 | <16 | <850 | 57 |
| 913-TS-P-1 | <3.4 | <3.4 | 6.1 | <3.4 | <3.4 | <3.4 | <3.4 | <6.6 | 36 | <6.6 | <6.6 | <3.4 | <6.6 | <6.6 | <340 | 42 |
| 915-TS-P-1 | <1.7 | <1.7 | 2.4 | <1.7 | <1.7 | <1.7 | <1.7 | <3.3 | 20 | 2.1 | <3.3 | <1.7 | <3.3 | <3.3 | <170 | 25 |
| 917-TS-P-1 | <6.8 | <6.8 | <6.8 | <6.8 | <6.8 | <6.8 | <6.8 | <13 | 96 | <13 | <13 | <6.8 | <13 | <13 | <680 | 96 |
| 919-TS-P-1 | <1.7 | <1.7 | <1.7 | <1.7 | <1.7 | <1.7 | <1.7 | <3.3 | 13 | <3.3 | <3.3 | <1.7 | <3.3 | <3.3 | <170 | 13 |
| 1005-TS-P1 | <17 | <17 | <17 | <17 | <17 | <17 | <17 | <33 | 11 | <33 | <33 | <17 | <33 | <33 | <1700 | 11 |
| 1005-TS-P2 | <340 | <340 | <340 | <340 | <340 | <340 | <340 | <660 | 4200 | <660 | <660 | <340 | <660 | <660 | <34000 | 4200 |
| 1006-TS-P1 | <68 | <68 | <68 | <68 | <68 | <68 | <68 | <130 | 670 | <130 | <130 | <68 | <130 | <130 | <6800 | 670 |
| 1017-TS-P1 | <8.5 | <8.5 | <8.5 | 29 | <8.5 | <8.5 | <8.5 | <16 | 55 | 9.5 | <16 | <8.5 | <16 | <16 | <850 | 55 |
| 1020-TS-P1 | <1.7 | <1.7 | <1.7 | <1.7 | <1.7 | <1.7 | <1.7 | <3.3 | 8.8 | <3.3 | <3.3 | <1.7 | <3.3 | <3.3 | <170 | 9 |
| No. of Sample | 18 | 18 | 18 | 18 | 18 | 18 | 18 | 18 | 18 | 18 | 18 | 18 | 18 | 18 | 18 | |
| Minimum | <1.7 | <1.7 | <1.7 | <1.7 | <1.7 | <1.7 | <1.7 | <3.3 | <3.3 | <3.3 | <3.3 | <1.7 | <3.3 | <3.3 | <170.0 | |
| Average | <36.5 | <39.9 | <38.3 | <37.6 | <36.5 | <36.5 | <36.5 | <70.3 | <441.3 | <71.0 | <70.3 | <36.5 | <70.3 | <70.3 | <3645.6 | |
| Maximum | <340 | <340 | <340 | 29 | <340 | <340 | <340 | <660 | 4200 | 27 | <660 | <340 | <660 | <660 | <34000 | |
| Standard Deviation | 77.2 | 77.2 | 76.7 | 77.0 | 77.2 | 77.2 | 77.2 | 149.8 | 948.1 | 149.6 | 149.8 | 77.2 | 149.8 | 149.8 | 7724.2 | |
(a)Total OCL pesticides are calculated from
detected values only.
Back to Appendix A | Table of Contents