
 |
Cost and Performance Report:
|
Note: This report is the final version of the EPA Cost and Performance Report for this application, and supersedes the interim version of this report published in March 1995. This final version reflects the most recent sampling of the vitrified material.
This case study was prepared for the U.S. Environmental Protection Agency’s Office of Solid Waste and Emergency Response, Technology Innovation Office. Assistance was provided by Radian International under EPA Contract No. 68-W3-0001 and U.S. Army Corps of Engineers Contract No. DACA45-96-D-0016.
This report presents cost and performance data for an in situ vitrification (ISV) treatment application at the Parsons Chemical/ETM Enterprises Superfund Site (Parsons) in Grand Ledge, Michigan. The Parsons site is a former agricultural chemicals mixing, manufacturing, and packaging facility. Soils and sediments at the Parsons site were contaminated with pesticides, heavy metals, and dioxins.
ISV treatment of approximately 3,000 yds3 of contaminated soils and sediments at the Parsons site, consisting of eight melts, was performed from May 1993 to May 1994. This was notable for being the first full-scale application of ISV treatment at a Superfund site.
Treatment performance data for this application include SITE program results for surface soil samples and stack gas emissions, results for "typical" stack gas emissions provided by the vendor, and confirmation coring analytical results.
Confirmation coring sampling could not be performed until after the ISV melt had cooled, approximately one year after treatment was completed. Three corings, or drill holes, were performed in locations selected to represent the areas with potential residual contamination. Samples were collected in the vitrified material and in the containment soil approximately 3 to 4 feet beneath the bottom of the glassified material. Vitrified material was analyzed for mercury and pesticides using a TCLP, while containment soil was analyzed for volatiles and semivolatiles using a total waste analysis. The confirmation coring sampling results indicated that the vitrified material in all three drill holes had mercury and pesticide concentrations below detection limits, and therefore that the vitrified material met the cleanup goals for this application. Also, analytical data for volatiles and semivolatiles in the containment soil beneath the three drill holes were reported as below detection limits, indicating that volatiles and semivolatiles were not present in the soil beneath the vitrified material.
In addition, the SITE program results and results for typical stack gas emissions show that this application met the soil cleanup standards and off-gas emission ARARs for this application. The stack gas emissions for chlordane and 4,4'-DDT were several orders of magnitude lower than the ARARs. A volume reduction of approximately 30% for the test soil was achieved in this application, based on the results from analyses of soil dry density.
The cleanup contractor’s cost ceiling for the ISV treatment application at Parson’s was $1,763,000, including $800,000 for vitrification, which corresponds to $270 per cubic yard of soil treated. The estimated before-treatment costs for this application of $800,000 were high because of the need to excavate and stage the wastes prior to treatment.
Table of Contents | Forward to Site Identifying Information
Parsons Chemical/ETM Enterprises
Grand Ledge, Michigan
CERCLIS #: MID980476907
Action Memorandum Date: 21 September 1990
Type of Action: Removal
Treatability Study Associated with Application? Information not available
at this time
EPA SITE Program Test Associated with Application? Yes (see reference
41)
Period of Operation: 5/93-5/94
Quantity of Material Treated During Application: 3,000 cubic yards of
contaminated soils and sediments (5,400) tons [41]
Historical Activity That Generated Contamination at the Site: Mixing,
manufacturing, and packaging of agricultural chemicals
Corresponding SIC Code: 2879 (Agricultural Chemicals - not elsewhere
classified)
Waste Management Practices That Contributed to Contamination: Manufacturing
process
Site History:The Parsons site, located near Grand Ledge, Michigan, as shown in Figure 1, is a former agricultural chemicals mixing, manufacturing, and packaging facility. Materials handled during Parsons’ operation included pesticides, herbicides, solvents, and mercury-based compounds. Parsons occupied the property from April 1945 until 1979. The site is presently owned by ETM Enterprises, a manufacturer of fiberglass. [2]
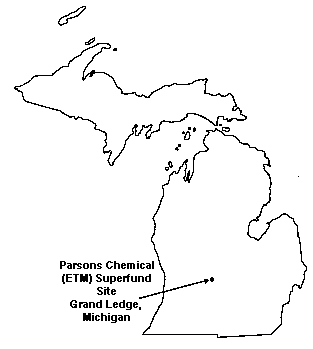
Figure 1. Site Location
Wash water from Parsons’ operations was discharged through floor drains to a catch basin leading to the county drain system. The county drain system flows to an unnamed creek which ultimately empties into the Grand River. In 1979 and 1980 the Michigan Department of Natural Resources (MDNR) collected sediment samples from the unnamed creek and a ditch located on the north boundary of the site. Elevated levels of lead, mercury, arsenic, and pesticides, including dichloro-di-phenyl-trichloroethane (DDT) and chlordane were detected in the samples. A hydrogeological investigation, performed during 1980, identified a septic tank and leach field system as the source of contamination. The septic tank and leach field were subsequently excavated in 1983.
Parsons was included in the Tier 3 dioxin screening under the National Dioxin Study conducted in 1984. 2,3,7,8-Tetrachloro-dibenzo-p-dioxins (TCDD) was detected in the ditch sediments at the site at a concentration of 1.13 ppb at the surface and 0.56 ppb at a depth of 18 inches below the surface. [2, 27]
Regulatory Context: An action memorandum, dated September 21, 1990, was approved by EPA to conduct a removal action at the Parsons site. The removal actions proposed for the site included 2]:
Cleanup requirements for the site were established for near-surface vitrified materials and air emissions, as discussed below under cleanup goals and standards. [25]
Remedy Selection: Several options were considered for cleanup of the Parsons site, including ISV, incineration, and stabilization. ISV was selected as the remedy because this technology was determined to be capable of reducing volume by 20 to 30%, decreasing the toxicity to near zero, and permanently immobilizing the hazardous substances on the site. ISV was also identified as less expensive than on-site incineration. 2]
Site Management: Fund Lead
Oversight: EPA
On-Scene Coordinator:
Len Zintak
U.S. EPA Region 5
77 West Jackson Boulevard
Chicago, IL 60604-3507
(312) 886-4246
Treatment System Vendor:
James E. Hansen
Geosafe Corporation
2950 George Washington Way
Richland, WA 99352
(509) 375-0710
Back to Executive Summary |
Table of Contents | Forward to Matrix
Description
Type of Matrix Processed Through the Treatment System: Soil (in situ)
Primary contaminant groups: Pesticides, heavy metals; and dioxin
The maximum concentrations measured in the soil at Parsons
for specific contaminants are shown in Table 1. [27]
Table 1. Maximum Contaminant Concentrations in Soil [27]
| Contaminant | Maximum Concentrations in Soil (µg/kg) |
|---|---|
| g-BHC (Lindane) | 78000 |
| Bis(2-ethylhexyl) phthalate | 28000 |
| Butyl benzyl phthalate | 6400 |
| Chlordane | 89000 |
| 4,4'-DDD | 48000 |
| 4,4'-DDE | 37000 |
| 4,4'-DDT | 340000 |
| Dieldrin | 87000 |
| Endosulfan sulfate | 1300 |
| Fluoranthene | 1200 |
| Hexachlorobenzene | 2600 |
| Mercury | 34000 |
| Methoxychlor | 850 |
| 2-Methylnaphthalene | 1100 |
| Phenanthrene | 990 |
| Pyrene | 1400 |
| 2,3,7,8-Tetrachloro-dibenzo-p-dioxin | 1.13 |
| Zinc | 150000 |
The major matrix characteristics affecting cost or performance for this technology and their measured values are presented in Table 2.
Table 2. Matrix Characteristics [4, 11]
| Parameter | Value | Measurement Procedure |
|---|---|---|
| Soil Classification | Silty Clay | Not Available |
| Clay Content and/or Particle Size Distribution | Not Available | - |
| Moisture Content | Not Available | - |
| Soil Dry Density | 1.48 tons/yd³ | Not Available |
The soil at Parsons was reported to be difficult to work with under very wet and very dry conditions. Wet conditions caused the soil to become highly fluid and exhibit a noticeable sulfurous odor. Under dry conditions, the soil became concrete-like. The soil also had a very high moisture content, and the soil moisture contained a high level of dissolved solids. [25]
Back to Site Identifying Information | Table of Contents | Forward to Treatment System Description
In Situ Vitrification
Post-treatment (air) using quench, scrubber, and thermal oxidizer
In situ vitrification (ISV) is an immobilization technology designed to treat media contaminated with organic, inorganic, and radioactive contaminants. The primary residual generated by ISV is the vitrified soil product. Secondary residuals generated by ISV include air emissions, scrubber liquor, carbon filters, and used hood panels. [41]
System Description
The ISV system used at Parsons consisted of 9 melt cells, as shown in Figure 2, an air emissions control system, and associated equipment. The melt cells were installed in a 16-foot deep treatment trench; each cell was 26 feet by 26 feet square. The trench was designed with a cobble wall and drain system to direct perched water that flowed into the site around the melt cells. [25]
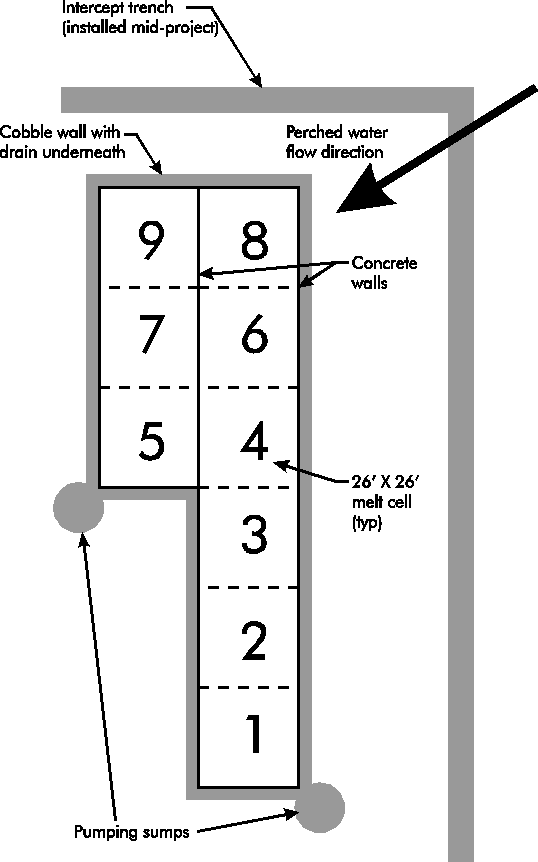
Figure 2. Plan View of Treatment Cells [25]
The air emissions control system used at Parsons consisted of an off-gas collection hood, a quencher, a water scrubber, and a thermal oxidizer. The thermal oxidizer was added midway through the project to help control stack gas odors. [25]
Associated equipment used at the Parsons site included electrical transformers, capacitor tanks, natural gas metering equipment, and thermocouples and other monitoring equipment. [13]
The following technology description is an excerpt from the SITE Technology Capsule [41]:
“The ISV Technology [used at Parsons] operates by means of four graphite electrodes, arranged in a square and inserted a short distance into the soil to be treated. A schematic of the Geosafe process is presented in Figure 3.
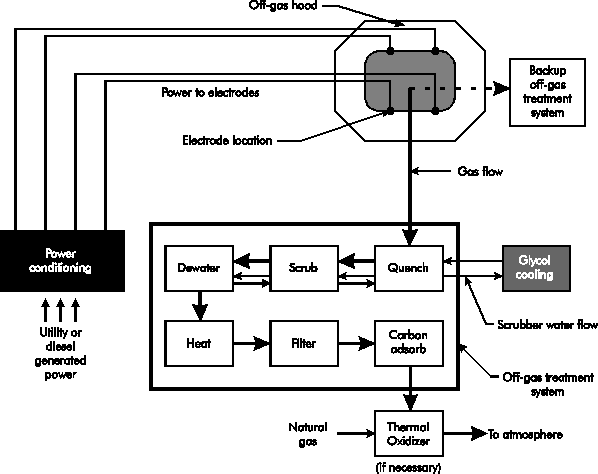
Figure 3. Geosafe In Situ Vitrification Process [41]
ISV uses electrical current to heat (melt) and vitrify the treatment material in place. A pattern of electrically conductive graphite containing glass frit is placed on the soil in paths between the electrodes. When power is fed to the electrodes, the graphite and glass frit conducts the current through the soil, heating the surrounding area and melting directly adjacent soil.
Molten soils are electrically conductive and can continue to carry the current which heats and melts soil downward and outward. The electrodes are allowed to progress down into the soil as it becomes molten, continuing the melting process to the desired treatment depth. One setting of four electrodes is referred to as a “melt.” Performance of each melt occurs at an average rate of approximately three to four tons/hr.
When all of the soil within a treatment setting becomes molten, the power to the electrodes is discontinued and the molten mass begins to cool. The electrodes are cut near the surface and allowed to settle into the molten soil to become part of the melt. Inorganic contaminants in the soil are generally incorporated into the molten soil which solidifies into a monolithic vitrified mass similar in characteristics to volcanic obsidian. The vitrified soil is dense and hard, and significantly reduces the possibility of leaching from the mass over the long term.
The organic contaminants in the soil undergoing treatment are pyrolyzed (heated to decomposition temperature without oxygen) and are generally reduced to simple gases. The gases move to the surface through the dry zone immediately adjacent to the melt, and through the melt itself. Gases at the surface are collected under a stainless steel hood placed over the treatment area and then treated in an off-gas treatment system. The off-gas treatment system comprises a quencher, a scrubber, a demister, high efficiency particulate air (HEPA) filters, and activated carbon adsorption to process the off-gas before releasing the cleaned gas through a stack. A thermal oxidizer can be used following the off-gas treatment system to polish the off-gas before release to the atmosphere. A thermal oxidizer was utilized during the SITE Demonstration at the Parsons site."
System Operation
Eight melts were required to vitrify the soil in the nine melt cells. These melts were performed at the Parsons site from June 1993 to May 1994. As shown on Table 3, these melts ranged in duration from 10 to 19.5 days, and consumed from 559,200 to 1,100,000 kilowatt-hours of electricity per melt. The melts required approximately one year to be sufficiently cooled to sample. [10-24] Confirmation borings were collected in April 1995 (see discussion under "Treatment Performance Data").
Table 3. Operational Data [10-24]
| Melt # | Cell # | Soil Treated* (cubic yards) | Duration of Melt (days) | Power Consumed (kilowatt-hours) | Natural Gas Consumed in Thermal Oxidizer (cubic feet) |
|---|---|---|---|---|---|
| 1 | 1 and part of 2 | 300 | 19.5 | 1,100,000 | N/A |
| 2 | 2 and part of 3 | 330 | 14 | 934,000 | N/A |
| 3 | part of 3, 4 and 7 | 621 | 16.7 | 1,018,000 | N/A |
| 4 | 7 and part of 4, 5, and 8 | 672 | 16 | 996,000 | N/A |
| 5 | 5 and part of 4, 6, and 8 | 655 | 16 | 1,084,800 | 4,100,000 |
| 6 | 8 and part of 5, 7, and 9 | 377 | 10 | 559,200 | Not Available |
| 7 | 6 and part of 5, 8, and 9 | 575 | 14 | 836,985 | Not Available |
| 8 | 9 and part of 6 and 8 | 426 | 11.5 | 640,800 | Not Available |
N/A - Not applicable; thermal oxidizer not installed until
after Melt #4 complete.
*Quantities shown are Geosafe estimates of contaminated and clean soil treated;
total quantity of soil treated greater than 3,000 cubic yards of contaminated
soil because treatment of clean soil occurred in this application.
**SITE Demonstration Program test.
The SITE Technology Capsule provides the following description of system operation at Parsons [41]:
“At the Parsons site, the original soil contamination was relatively shallow, five feet or less, and located in three main areas. To increase the economic viability of treatment at this site, the contaminated soil was excavated and consolidated into a series of nine treatment cells. The cell walls were built using concrete, cobble, and particle board as shown in Figure 4. The cells were constructed by trenching an area of the site, installing particle board and concrete forms, and pouring concrete into the forms to create the nine cell settings. A one-foot layer of cobble was placed in the bottom of each cell, and approximately two feet of cobble was used to surround the exterior of the cell forms. The use of cobble at the sides was intended as a means to retard melting out into adjacent clean soil. The bottom cobble was used to provide a drainage pathway for water that was known to be present on-site; the resultant flow of water was directed to a drainage trench. After construction, the cells were filled with contaminated soil from the site, and topped with a layer of clean soil.
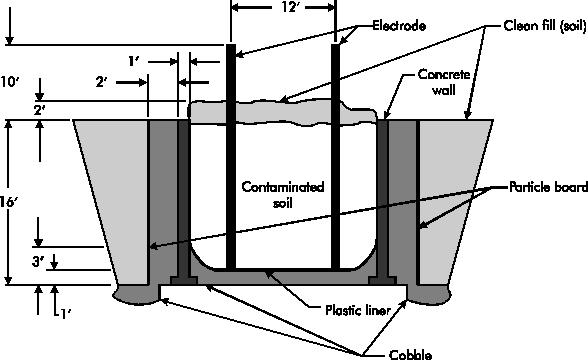
Figure 4. Side View of Typical ISV Treatment Cell [41]
During the treatment of the first few cells, problems with the cell design were observed. The intense heat that was melting the soil was also thermally decomposing the particle board forms. Analysis of water samples collected from the diversion system surrounding the cells identified volatiles (benzene), phenolics, and epoxies that were released by this decomposition. The cobble outside of the cells created porous paths in the vicinity of treatment, thereby increasing the likelihood of vapors escaping the area outside the hood and causing irregular melt shapes.
Geosafe responded by excavating the area outside of the remaining treatment cells and removing the particle board forms. A refractory ceramic material with insulating and reflective properties was placed adjacent to the exterior of the concrete cell walls. This helped to control the melt shape, limit fugitive vapor emissions, and restrict the melt energy inside the cell boundaries. . . . . It should be noted that the use of cobble in treatment cell construction was unique to the Parsons site where the configuration and flow of the on-site groundwater dictated its application.
Utility requirements for this technology include electricity, natural gas (if a thermal oxidizer is used), and water. As expected, electricity is a major consideration when implementing ISV. Total power to the electrodes during treatment is approximately three MW; the voltage applied to each of the two phases during steady state processing averages around 600 volts while the current for each phase averages approximately 2,500 amps.”
The major operating parameters affecting cost or performance for this
technology and the values measured for each are presented in Table 4.
Table 4. Operating Parameters [10-24]
| Parameter | Value | Measurement Procedure |
|---|---|---|
| Soil Treated | 300-672 cubic yards per melt | Vendor estimate |
| Melt Duration | 10-19.5 days per melt | - |
| Power Consumption | 559,200-1,100,000 kWh/melt | - |
A timeline for this application is shown in Table 5.
| Start Date | End Date | Activity |
|---|---|---|
| 3/89 | - | Parsons added to NPL |
| 9/90 | - | Action memorandum signed |
| 10/90 | 4/91 | Site preparation work completed (excavation and staging of 3,000 cubic yards into ISV treatment cells) |
| 3/91 | - | Operational acceptance test terminated due to fire |
| 5/93 | 6/93 | Mobilization of equipment and personnel to site |
| 6/93 | 9/93 | ISV treatment conducted |
| 9/93 | 11/93 | ISV treatment suspended for 9 weeks pending discussions about scrubber solution disposition, stack gas odors, groundwater disposition, and melt shape |
| 11/93 | 12/93 | ISV treatment continued |
| 1/94 | - | Thermal oxidizer installed to control stack gas odors |
| 2/94 | 5/94 | ISV treatment continued |
| 3/94 | 4/94 | SITE Demonstration Program test (Melt #6) |
| 5/94 | expected '95 | Decontamination, dismantling, and demobilization conducted |
| 4/95 | - | Confirmation corings collected |
Back to Matrix Description | Table of Contents | Forward to Treatment System Performance
Cleanup requirements were established for soils remaining on site and for off-gases from the ISV unit, as shown below in Table 6.
Table 6. Cleanup Requirements [25, 28]
| Contaminant | Soil CleanupStandards (mg/kg) | Off-Gas State ARAR (lbs/hr) |
|---|---|---|
| Chlordane | 1 | 25 |
| 4,4'-DDT | 4 | 0.01 |
| Dieldrin | 0.08 | 0.00028 |
| Mercury | 12 | 0.00059 |
Treatment performance data for this application include SITE Program data for vitrified soil, analyses of stack gas emissions, and confirmation corings. Table 7 shows selected results from the SITE Demonstration for vitrified soil and stack emissions in melt #6. During the SITE Demonstration, three samples of vitrified soil were collected from the surface of Cell 8, and analyzed for pesticides and metals (total and TCLP). Stack gas emissions were also tested for total hydrocarbons (THC) and carbon monoxide (CO). During the SITE Demonstration, THC and CO were each measured at less than 10 ppmv. [41]
Table 7. Selected Results from the SITE Demonstration Program for Melt #6 [41]
| Before-Treatment Soil | After-Treatment Surface Soil | Stack Gas Emissions | ||||
|---|---|---|---|---|---|---|
| Contaminant | Total (µg/kg) | TCLP (µg/L) | Total (µg/kg) | TCLP (µg/L) | Concentration (µg/m³) | Mass (lbs/hr) |
| Chlordane | <80 | <0.5 | <80 | <0.5 | <1.38 | <0.000011 |
| 4,4'-DDT | 2,400-23,100 | 0.12-0.171 | <16 | <0.1 | <0.28 | <0.0000022 |
| Dieldrin | 1,210-8,330 | 6.5-10.2 | <16 | <0.1 | <0.28 | <0.0000022 |
| Arsenic | 8,380-10,100 | NA | 717-5,490 | <4-30.5 | <0.269 | <0.000001293 |
| Chromium | 37,400-47,600 | NA | 12,500-14,600 | <10-17.1 | 2.081-3.718 | 0.0000148-0.0000267 |
| Lead | <50,000 | NA | <5,000-21,000 | <50-4,290 | <3.891 | <0.0000282 |
| Mercury | 2,220-4,760 | NA | <40 | <0.2-0.23 | 12.9-17.7 | 0.0000989-0.000125 |
NA- Not analyzed
Table 8 shows typical stack gas emission performance data as reported by the vendor.
Table 8. Typical Stack Gas Emissions [25]
| Contaminant | State ARAR (lbs/hr) | Stack Gas Emission (lbs/hr) |
|---|---|---|
| Chlordane | 25 | <0.00000011 |
| 4,4'-DDT | 0.01 | <0.000022 |
| Dieldrin | 0.00028 | <0.000022 |
| Mercury | 0.00059 | 0.00012 |
Confirmation Corings [42]
Confirmation corings were performed in April 1995 after the melt had cooled for approximately one year. Three confirmation corings were drilled at the site, consisting of the following: Drill Hole (DH) 101, positioned on melt 1, cell 1; DH 102, positioned on melt 3, between cells 3 and 4; and DH 103, positioned between melts 5 and 7, cell 5. These corings locations were selected to represent the areas with potential residual contamination. Areas were selected based on an evaluation of areas which had 1) failed to burn out bottom thermocouples as planned, and 2) showed inadequate melt depth, as indicated by electrode depth below grade level.
Corings were performed as follows: the first 5 feet of overburden in each location was drilled using a 4 1/4-inch diameter hollow stem auger. The vitrified material beneath the overburden (the upper portion of vitrified material is referred to as the vesicular region) was first scored using a 2 1/2-inch diameter tricone rotary bit, and then drilled using a 2 3/4-inch diameter diamond-impregnated #10 Longyear drill bits. Material beneath the vitrified material, such as the lower vesicular region, underlying cobble, and underlying soil, was drilled using a 3-inch diameter split spoon sampler with a cable tool driver.
Core sections were collected from several depths within each of the three coreholes and analyzed by EPA's and Geosafe's laboratories. Table 9 summarizes the depths that were sampled for each corehole, the type of material sampled (e.g., glass, soil), and the corresponding analytical results for the samples analyzed by Geosafe's laboratory. No data are contained in the available references on the analytical results for the samples analyzed by EPA's laboratory.
Table 9. Analytical Results for Confirmation Coring Samples Collected by Geosafe [42]*
| Drill Hole Identifier | Sample Depth (FT) | Sampled Material | Mercury and Pesticides** | Volatiles | Semivolatiles |
|---|---|---|---|---|---|
| DH-101 | 10 | Glass | ND | NA | NA |
| DH-101 | 14 | Glass | ND | NA | NA |
| DH-101 | 18 | Containment Soil | NA | ND | ND |
| DH-101 | 19 | Containment Soil | NA | ND | ND |
| DH-101 | 10.5 | Glass | ND | NA | NA |
| DH-102 | 13.5 | Glass | ND | NA | NA |
| DH-102 | 17 | Containment Soil | NA | NA | NA |
| DH-103 | 9 | Glass | ND | NA | NA |
| DH-103 | 12 | Glass | ND | NA | NA |
| DH-103 | 15 | Containment Soil | NA | ND | ND |
| DH-103 | 16 | Containment Soil | NA | ND | ND |
ND=None Detected (detection limit not provided)
NA=Not Analyzed
*Specific pesticides, volatiles, and non-volatiles analyzed for this
application were not identified in the available references.
**Results shown for mercury and pesticides are based on TCLP
analysis.
The treatment performance data in Table 7 shows that the surface soil samples and stack gas emissions measured during the SITE Demonstration met the soil cleanup standards and off-gas State ARARs for this application. In addition, the typical stack gas emission data provided by the vendor, as shown in Table 8, show compliance with the State ARARs. The data in Table 8 show that the stack gas emissions for chlordane and 4,4'-DDT were several orders of magnitude lower than the ARARs.
The data in Table 7 show a reduction in total waste analysis concentrations from levels as high as 23,100 µg/kg to levels less than 11 µg/kg for chlordane, 4,4'-DDT, and dieldrin in surface soil samples. Concentrations of metals in a TCLP extract are shown to be reduced from as high as 21,000 µg/L to levels less than 5,000 µg/L.
Additional data from the SITE Demonstration show a volume reduction of approximately 30% for the test soil, based on the results from analyses of soil dry density.
The confirmation coring sampling results shown in Table 9 indicate that the vitrified material in all three drill holes had mercury and pesticide concentrations below detection limits, as measured using a TCLP analysis, and therefore that the vitrified material met the cleanup goals for this application. Note that the available references do not state the specific pesticide constituents analyzed or provide the detection limits achieved in this application. Also as shown in Table 9, analytical data for volatiles and semivolatiles in the containment soil beneath the three drill holes were reported as below detection limits, indicating that volatiles and semivolatiles were not present in the soil beneath the vitrified material. Again the specific constituents analyzed and the detection limits achieved in this application were not provided in the available references. The containment soil samples were collected approximately three to four feet beneath the bottom of the vitrified material in each of the three drill holes.
Data are available to characterize the results of the ISV application at Parsons, including data on stack gas emissions, surface soil samples collected during the SITE Demonstration, and confirmation boring sampling of the vitrified material.
Soil sampling and analysis for the SITE Demonstration was conducted following EPA SW-846 analytical methods. No exceptions to the methods were noted in the available references. The SITE Technology Capsule, however, identified a possibility that other, non-EPA approved, methods may provide more accurate determinations for metals in vitrified materials. The vendor reported that all glass and underlying containment soil samples were analyzed by IEA Laboratories under "Level II QA/QC procedures;" no deviations from acceptable procedures were identified by the vendor.
Back to Treatment System Description | Table of Contents | Forward to Treatment System Cost
EPA contracted with Geosafe Corporation to construct and operate the ISV system at the site. Geosafe used several subcontractors to implement specific aspects of the operation. Information about the competitive nature of the procurement process is not available at this time. [10]
Although final cost information is not yet available, preliminary treatment system cost information is available from EPA, as presented in Tables 10-13. An action memorandum identified cost ceilings for this application totalling $3,466,967, including $1,763,000 for the cleanup contractor, as shown in Table 10. [1] In negotiating the contract with Geosafe, EPA established objectives for nine cost elements, as shown in Tables 11-13. The delivery order for Geosafe specified a ceiling value of $1,690,305. The reason for the discrepancy between the $1,763,000 and $1,690,305 values is not available at this time. [24]
In order to standardize reporting of costs among projects, costs are shown in Tables 11-13 according to the format for an interagency Work Breakdown Structure (WBS). The WBS specifies 9 before-treatment cost elements, 5 after-treatment cost elements, and 12 cost elements that provide a detailed breakdown of costs directly associated with treatment. Tables 11, 12, and 13 present the cost elements exactly as they appear in the WBS, along with the specific activities, and unit cost and number of units of the activity (where appropriate), as provided in the Contract Negotiation Cost Objectives. [31]
Table 10. Cost Ceiling Shown in Action Memorandum [1]
| Cleanup Contractor | $1,763,000 |
| Contingency (15%) | $264,450 |
| Subtotal | $2,027,450 |
| TAT | $716,000 |
| Extramural subtotal | $2,743,450 |
| Extramural Contingency | $411,517 |
| Total for Extramural Costs | $3,154,967 |
| U.S. EPA Direct Costs | $120,000 |
| EPA Indirect Costs | $192,000 |
| TOTAL for Intramural Costs | $312,000 |
| TOTAL for Removal Project | 3,466,967 |
Table 11. Before-Treatment Cost Elements [Adapted from 31]
| Cost Element | Cost Objective |
|---|---|
| Mobilization and
Preparatory Work - Mobilization - Site Administration - Site Preparation |
$150,000 $220,000 $4,000 |
| Monitoring, Sampling, Testing, and Analysis - Soil - Glass - Air - Water |
$80,000 $10,000 $130,000 $25,000 |
| Site Work - Uncontaminated Soil - Contaminated Soil |
$80,000 $100,000 |
Table 12. Treatment Cost Elements [31]
| Cost Element | Cost Objective |
| Operation (short-term - up
to 3 years) - Vitrification |
$800,000 |
Table 13. After-Treament Cost Elements [Adapted from 31]
| Cost Element | Cost Objective |
| Site Restoration
- Backfill and Grade - Seeding - Drainage Structures |
$80,000 $4,500 $2,500 |
| Demobilization | $77,000 |
Limited data are available at this time to assess the cost for this treatment application. The cost data shown in this report were provided by EPA as contract negotiation cost objectives.
The vendor stated that the costs for the application at Parsons were unusually high, and expects that the costs for future applications will be lower. Key factors affecting costs for ISV include: [41]
Back to Treatment System Performance | Table of Contents | Forward to Observations and Lessons Learned
Back to Treatment System Cost | Table of Contents | Forward to References
This case study was prepared for the U.S. Environmental Protection Agency’s Office of Solid Waste and Emergency Response, Technology Innovation Office. Assistance was provided by Radian International under EPA Contract No. 68-W3-0001 and U.S. Army Corps of Engineers Contract No. DACA45-96-D-0016.
Back to Observations and Lessons Learned | Table of Contents