geophysical methods
Self or Spontaneous Potential
Self or spontaneous potential (SP) logging is one of the oldest borehole geophysical methods, first developed in 1931 for application in the oil and gas industry (Schlumberger). When used as a borehole geophysical tool, SP logs record the naturally occurring potentials that develop at lithologic contacts. SP is often used to identify variations in lithology such as differentiating between shale or clay beds, relative sand and shale content, permeable beds, thickness of beds, and water quality. When used in conjunction with other logging methods such as gamma logging, SP logs can be used to correlate lithology and facies across a site (U.S. EPA, 1993).
SP can also be deployed as a surface geophysical tool. Data can be collected from probes deployed at the ground surface to evaluate a number of subsurface conditions, for example, to detect leaks from tailings dams and reservoir dams, trace subsurface flow patterns, monitor groundwater flow at landfill sites, detect leaks from membrane-lined sites, and monitor conductive contaminant plumes and remediation progress (U.S. EPA, 1993).
Typical Uses
Most surface SP investigations qualitatively evaluate the potential profile or contours to evaluate self-potential anomalies. Generally, fluid inflow produces negative relative potentials, and fluid outflow results in positive potentials.
Quantitative interpretations for a dam embankment with possible seepage are determined from surface survey profiles across the crest. SP anomalies may indicate errant flow through the dam at some depth. The width of the half-amplitude provides a depth estimate. Outflow at the toe of an embankment or at shallow depths beneath the toe would produce positive, narrow anomalies.
Mining-influenced water can create the largest potential anomalies due to the redox reactions that occur between the sulfides and groundwater.
Typically, SP borehole logs are collected along with a suite of other geophysical logs such as resistivity and gamma logs to refine a conceptual site model. Inflections in a log can indicate boundaries between intervals with more clay or shale and intervals of more permeable sand. Correlating the more permeable sand units across a contaminated site helps identify zones where there may be migration of contaminated groundwater. Gamma logs, like SP logs, can be used to correlate lithology, locate bed boundaries, identify shales, and estimate shale content. SP logs can be used to calculate the conductivity of the formation water![]() if the formation is a thick clean sandstone and contains electrolytic solutes like sodium chloride (Keys, 1990; Collier, 1993
if the formation is a thick clean sandstone and contains electrolytic solutes like sodium chloride (Keys, 1990; Collier, 1993![]() ).
).
Theory of Operation
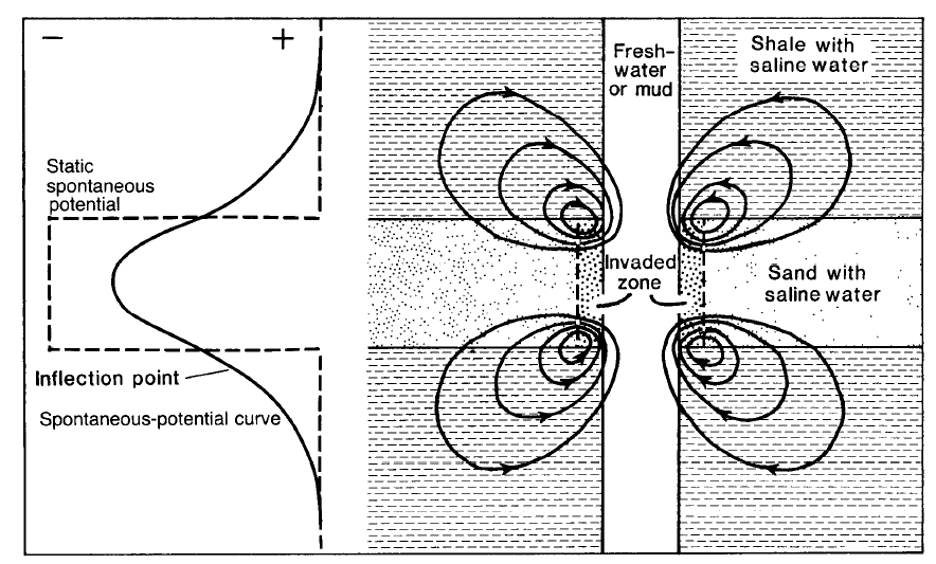
Figure 1. Flow of current at typical bed contacts and the resulting spontaneous potential curve and static values (Keys, 1990).
Geologic materials naturally generate a static and measurable electrical potential due to electrochemical![]() and electrokinetic
and electrokinetic![]() effects. The most significant contribution to SP is from electrochemical effects, which are subdivided into liquid junction1 and membrane potentials2. Figure 1 depicts both the liquid junction and membrane potential developed in a borehole. The left panel shows a typical SP log curve where the formation water is more saline than the borehole fluid. Negatively charged shale particles preferentially draw in cations from the formation water. The cations follow the concentration gradient to the borehole. The SP log shows a positive relative value at the shale, where the cation concentrations are enriched in the borehole. If instead, the borehole fluid is more saline than the formation water, the SP log will be more negative at the shale layer than the sandstone, because the shale will preferentially remove cations from the more concentrated borehole fluid (Keys, 1990).
effects. The most significant contribution to SP is from electrochemical effects, which are subdivided into liquid junction1 and membrane potentials2. Figure 1 depicts both the liquid junction and membrane potential developed in a borehole. The left panel shows a typical SP log curve where the formation water is more saline than the borehole fluid. Negatively charged shale particles preferentially draw in cations from the formation water. The cations follow the concentration gradient to the borehole. The SP log shows a positive relative value at the shale, where the cation concentrations are enriched in the borehole. If instead, the borehole fluid is more saline than the formation water, the SP log will be more negative at the shale layer than the sandstone, because the shale will preferentially remove cations from the more concentrated borehole fluid (Keys, 1990).
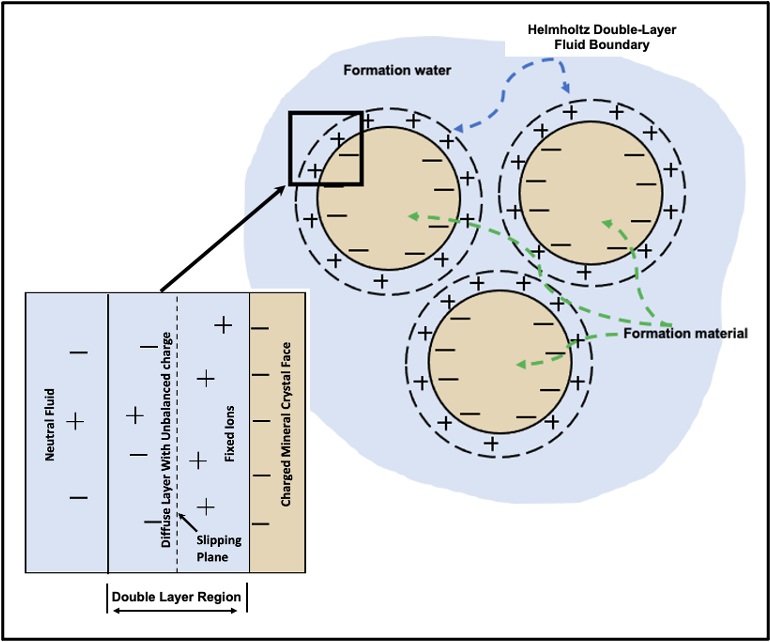
Figure 2. Schematic of flow-induced negative electrokinetic potentials (modified from Erchul and Slifer, 1989; Collier, 1993![]() ).
).
Electrokinetic potential, also called "streaming potential" or "electrofiltration potential," develops when ionic solutions flow through a non-metallic porous media (Figure 2). The moving fluid shears the electric double layer3 found along the pore walls of the solid material in the formation. This movement of anions (an electrical current) with respect to the positively charged fixed layer creates a potential. Electrokinetic potential usually contributes only millivolts to the SP signal.
Factors affecting electrokinetic potential include the pressure differential between the formation water and the borehole fluid, fluid movement rate, moving fluid resistivity, and the thickness of the mudcake. Under normal conditions and the use of good quality drilling mud, these factors are not conducive to the development of electrokinetic potential, making it insignificant. However, under certain conditions, these factors may lead to the development of large electrokinetic potentials (Collier, 1993![]() ; Erchul and Slifer, 1989).
; Erchul and Slifer, 1989).
System Components
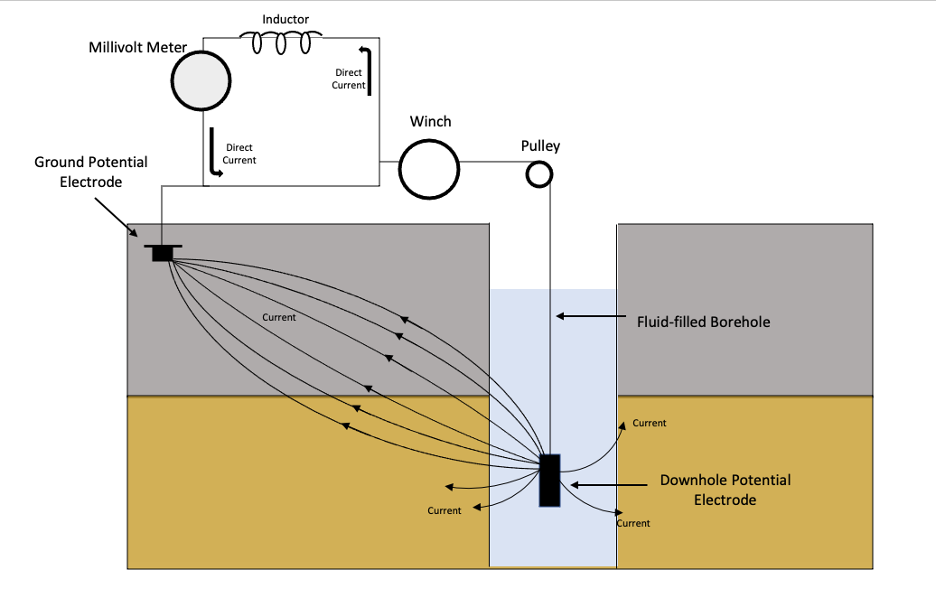
Figure 3. A simplified schematic of the equipment used to make an SP log. An electrode is deployed down the fluid-filled borehole while a second electrode is deployed at the land surface as a ground (modified from Keys, 1990).
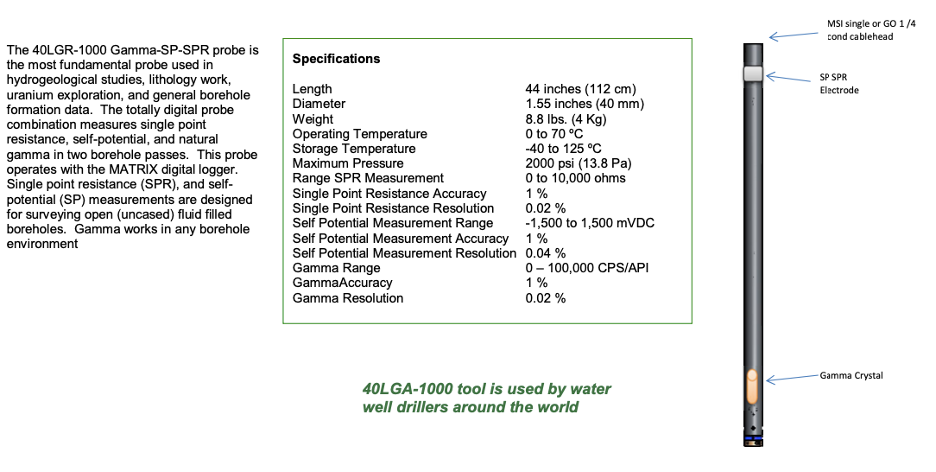
The equipment needed to collect SP data is simple. In the downhole application, a lead or stainless steel electrode is deployed via wireline down a borehole. It is connected to a grounded electrode at the land surface with a millivolt meter/recorder between the two electrodes. Figure 3 provides a schematic of the simplified system used to collect just SP data from a borehole (modified from Keys, 1990). More typically, SP data are now collected using a multi-sensor probe4 that also include sensors for gamma and single-point resistance (SPR) in addition to the electrode for SP5. This allows the generation of multiple types of logs simultaneously. For the surface application, the system consists of a primary base electrode along with a roving or mobile electrode. The metal electrodes are suspended in porous pots in a supersaturated solution of their own salts; for example, a copper electrode would be suspended in copper sulfate. The electrodes are connected by wire wrapped with abrasion-resistant insulation. A high-input impedance voltmeter is used to read the potential in millivolts (Wightman, W., et al., 2004).
↩Modes of Operation
The SP data can be collected via a borehole or at the ground surface. When collected from a borehole, the probe containing the electrode is lowered down the borehole to collect continuous measurements. When deployed as a surface geophysical tool, the electrodes are simply leap-frogged over each other along a transect or grid, or the data are relative to a reference electrode where all electrodes are non-polarizing (U.S. Army Corps of Engineers, 1995![]() ).
).
Data Display and Interpretation
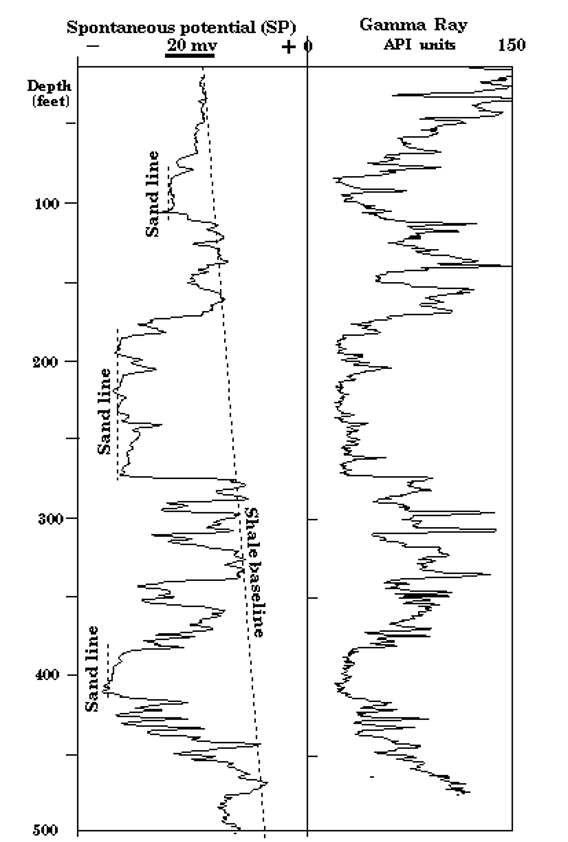
Figure 4. Although an SP and gamma log measure different physical properties, their sensitivity to shale is comparable (Kansas Geological Survey, 1996).
SP borehole logs are usually presented alongside other geophysical logs collected at the same time. The SP data are presented in plus or minus millivolts (mv) along the horizontal axis. The depth from land surface is plotted on the y-axis in feet. In the example shown in Figure 4, the SP data are presented along with gamma data. The gamma data are shown in API (American Petroleum Institute) units. In this example, the formation water has greater salinity than the borehole fluids. Deflections in the negative potential direction, in this case, indicate sandstone. A deflection in the positive potential direction indicates shale. If the salinity of the borehole fluid were greater than the formation water, the log would be reversed. The amplitude of the deflection is controlled by the difference in salinity between the borehole fluid and the formation water. When the salinity of the borehole fluid and the formation water are the same, the SP log would be a straight vertical line. The dotted line on the SP log is the shale baseline. The drift in the baseline in this log is due to the stronger sandstone differentiation at depth, where the increased salinity in the sandstone at depth in this location has caused a stronger response (Kansas Geological Survey, 1996).
Performance Specifications
| Parameter | Specification | Source |
| Minimum Borehole Diameter | 1.5-3.0" | U.S. EPA, 1993 |
| Radius of Measurement | Near borehole surface | U.S. EPA, 1993 |
| Vertical Resolution | 6-10 feet | AAPG, 2019 |
| Logging Speed | 25 ft/min to 60 ft/min | Consulted websites of several tool vendors: Pacific Surveys |
| Drilling Mud Type | Fluid must be water-based, fresh water, or saline (high salt) solutions. Fluid may contain barite or potassium salt for borehole stability. | AAPG, 2015 |
Advantages
SP logs offer several advantages:
- They provide useful supplemental information (identifying lithologic contacts, distinguishing shale from other rock types, estimating shale volume in sandstone) when interpreting other logs (Collier, 1993
 ).
). - They can be used to identify tops and bottoms of stratigraphic beds.
- They are simple to collect (U.S. EPA, 1993).
- Surface surveys can detect seeps, trace direction of groundwater flow, and detect mineralized regions.
Limitations
The application of SP logging has some limitations:
- The borehole must be uncased and filled with conductive fluid6 (Keys, 1990).
- SP logs are susceptible to multiple sources of interference7, including buried cables, pipelines, magnetic storms, and the flow of groundwater (U.S. EPA, 1987 and Keys, 1990).
- SP logs are unreliable for determining the resistivity of fresh formation water8 (Keys, 1990).
Use of SP logs for contaminated groundwater investigations can be complicated by the range of possible responses in freshwater aquifers. If the borehole fluid is less saline than the formation water (brackish aquifers), the SP response will be negative when encountering sand beds. If the borehole fluid is more saline than the formation water, the SP response will be positive when encountering sand beds. If the salinity of borehole fluid and formation water is the same, the SP response will be a straight line (U.S. Army Corps of Engineers, 1995![]() ). Thus, the use of SP logging where the borehole fluid and formation water have the same salinity is problematic.
). Thus, the use of SP logging where the borehole fluid and formation water have the same salinity is problematic.
Cost
Weekly SP logging probes rental ranges from $200-$300/week with additional fees for shipping and preparation; these prices are commonly advertised. Surface SP equipment typically rents for approximately $250/week.
↩Case Studies
Fracture Flow Characterization with Low-Noise Spontaneous Potential Logging
Kowalski, A., C. Mendonca, and U. Ofterdinger, 2021.
This study presents a procedure to identify fractures contributing groundwater flow using SP measurements by electrokinetic processes. Measurements were collected when the borehole water head was lowered and then monitored while recovering. The electrokinetic model for flow through a tabular gap was used to interpret the measured data.
Mapping the Pollution Plume Using the Self-Potential Geophysical Method: Case of Oum Azza Landfill, Rabat, Morocco
Touzani, M. et al., 2021.
The main landfill in Rabat is situated above a shallow Mio-Pliocene aquifer consisting of sandy material. The landfill has likely discharged leachate, creating a contaminant plume, but its extent is unknown. This paper explores the use of SP measurements from the soil surface in conjunction with direct measurements of the water table and leachate from the landfill to distinguish between the electrokinetic and electrochemical components responsible for the range of potentials observed.
Refining Well Log Interpretation Techniques for Determining Brackish Aquifer Water Quality
U.S. Bureau of Reclamation, 2019.
The study identified which geophysical well log data types are most critical and useful for brackish groundwater characterization. Common data gaps were identified for well log analysis. Techniques and alternate processes applicable to brackish groundwater characterization were presented and discussed.
![]() Identification of Potential Brackish Groundwater Production Areas – Blossom Aquifer
Identification of Potential Brackish Groundwater Production Areas – Blossom Aquifer
Texas Water Development Board (TWDB), 2017.
This study identified three potential production areas that could provide brackish water over a 30- to 50-year period. Geophysical well logs were used to estimate total dissolved solids.
Delineation of Soil and Groundwater Contamination Using Geophysical Methods at a Waste Disposal Site in Çanakkale, Turkey
Kaya, M., Gülçin Özürlan, G., and Şengül, E., 2007.
This study conducted SP, resistivity, and low frequency electromagnetic surveys and found good correlation between the geophysical investigations and the results of previously collected geochemical and hydrochemical measurements.
![]() Comparison of Surface and Sub-surface Geophysical Investigations in Delineating Fracture Zones
Comparison of Surface and Sub-surface Geophysical Investigations in Delineating Fracture Zones
Krishnamurthy, N., Kumar, D., Rao, S., Jain, C., and Ahmed, S., 2003.
Geophysical studies were carried out in the Maheshwaram watershed in India, including logging in some of the borewells. In some cases, the results of surface SP and resistivity sounding have considerable correlation with geophysical logs. The thin fractures could be identified with resistivity and gamma logs. The surface SP studies show potential anomalies, indicating the presence and continuation of fractures.
Application of Electric Well Logging and Other Well Logging Methods in Hawaii
Lao, C., F. Peterson, and D. Cox, 1969.
The primary objective of this study was to determine what results could be obtained using conventional electric and geophysical logging methods under Hawaiian conditions. Logging methods included spontaneous potential, point resistivity, short and normal resistivity, lateral resistivity, water temperature, water conductivity, and caliper.
↩References:
AAPG Wiki, 2015. Basic Tool Table. Website Consulted June 2021.
AAPG Wiki, 2019. Open Hole Tools. Website consulted June 2021.
Century Geophysical, LLC. Natural Gamma, SP, Res Logging Tool - 9014. Website consulted September 2021.
Collier, H., 1993. ![]() Borehole Geophysical Techniques for Determining the Water Quality and Reservoir Parameters of Fresh and Saline Water Aquifers in Texas.
Borehole Geophysical Techniques for Determining the Water Quality and Reservoir Parameters of Fresh and Saline Water Aquifers in Texas.
Erchul, R and D. Slifer, 1989. Geotechnical Applications of the Self Potential (SP) Method.
Kansas Geological Survey, 1996. Geophysical Log Analysis of the Dakota Aquifer.
Keys, W., 1990. ![]() Borehole Geophysics Applied to Ground-Water Investigations.
Borehole Geophysics Applied to Ground-Water Investigations.
Mount Sopris, 2019. 40LGR-1000 Data Sheet. Website consulted November 2022.
Pacific Surveys. ![]() Electric Log RSN/RLN/SP/GR/SPR. Website consulted September 2021.
Electric Log RSN/RLN/SP/GR/SPR. Website consulted September 2021.
Schlumberger, 2021. Our History. Website consulted June 2021.
Schlumberger, 2021. Oilfield Glossary. Website consulted June 2021.
U.S. Army Corps of Engineers, 1995. ![]() Geophysical Exploration for Engineering and Environmental Investigations. EM 1110-1-1802. August 31.
Geophysical Exploration for Engineering and Environmental Investigations. EM 1110-1-1802. August 31.
U.S. EPA, 1987. A Compendium of Superfund Field Operations Methods: Volume 1.
U.S. EPA, 1993. Subsurface Characterization and Monitoring Techniques.
Weatherford. Compact™ Array Induction Tool. Website consulted September 2021.
Wightman, W., et al., 2004. Application of Geophysical Methods to Highway Related Problems.
Helpful Information
Liquid junction potentials develop between the formation water and the drilling mud that infiltrates into the formation in the drilled zone (Keys, 1990). ↩
Liquid junction potentials develop between the formation water and the drilling mud that infiltrates into the formation in the drilled zone (Keys, 1990). ↩
Membrane potentials are created when ions in formation water migrate from porous sandstone to adjacent shale, which favors the passage of cations to the borehole fluid (Keys, 1990). ↩
Membrane potentials are created when ions in formation water migrate from porous sandstone to adjacent shale, which favors the passage of cations to the borehole fluid (Keys, 1990). ↩
-
The double layer (or electrical double layer) refers to the layer between a particle (clay or other formation material) and the formation water. This layer has a particular distribution of ions. The excess of negative charges on the clay particle surface attracts an excess of positive cations from formation fluid to an area near the interface between the clay particle and the formation fluid. The layer immediately next to the clay surface has no anions. The layer beyond this first layer of cations is an area where the ion concentration gradually approaches that of the formation fluid (Schlumberger). ↩
-
This is an example of a multi-sensor probe manufactured by Mount Sopris: ↩
-
This is an example of a multi-sensor probe manufactured by Mount Sopris: ↩
↩
↩The salinity of the borehole fluid must be greater or less than the salinity of the formation water. If the salinity of the borehole fluid and the formation water is the same, the SP log will be a straight line. Any change to either will cause a change to the SP log as well (Keys, 1990). ↩
The salinity of the borehole fluid must be greater or less than the salinity of the formation water. If the salinity of the borehole fluid and the formation water is the same, the SP log will be a straight line. Any change to either will cause a change to the SP log as well (Keys, 1990). ↩
-
Sources of interference include buried cables, pipelines, magnetic storms, and the flow of groundwater. These sources of interference can cause anomalous readings on the SP logs (EPA, 1987). A common source of noise is what is known as the battery effect. The steel armor on the logging cable can become magnetized, thus producing oscillations of the logs. As the tool is drawn up the borehole, variations in this battery effect may impress noise on the SP log. A solution to this phenomenon is wrapping the cable with insulating tape above the electrode (Keys, 1990). ↩
Formation water resistivity can be calculated by the equation:
SP = -K' log (Rm/Rw)
Where,
SP = Log deflection, in millivolts
K' = 60+0.133T'
T' = borehole temperature in degrees Fahrenheit
Rm = resistivity of borehole fluids in ohmmeters
Rw = formation-water resistivity in ohmmeters.
However, for this equation to be applied to calculate the resistivity of groundwater where the water contains less than 10,000 mg/L of dissolved solids, several conditions must exist:- The fluid in the borehole and in the formation water must be sodium chloride solutions.
- The borehole fluids must be fresh with a much greater resistivity than that of the sand and shale combined. This usually means that the formation water must be very saline.
- The sand must be free of clay, and the shale must be ideal ion-selective membranes. Streaming potential must be negligible.
These conditions are not met in most freshwater wells (Keys, 1990). ↩


