Left Navigation Bar
Background
Background
Needs
SBIR-Related Needs
Project Status
Literature Searches
Technology Focus
Contacts

Top Navigation Bar About the Technology Innovation ProgramU.S. Environmental Protection Agency
curve, top leftcurve, top right

Raman Spectroscopy
From Sedlacek et al. (2001)
Open Path Measurement Systems Home


> Basic Operation
> Alternatives to Conventional Open Path Raman Systems
> Chemical Detection Limits
> Demonstrated Uses in Environmental and Industrial Settings
> Experimental and Potential Uses for Open Path Raman in Environmental
    and Industrial Uses

> Experimental and Potential Uses for Other Raman Systems in Environmental
    and Industrial Uses

curve, top right

An open path Raman spectroscopy-based sensor can identify chemicals, and provide an average concentration over the distance measured or at specified distances when a lidar configuration is used. The instrument uses an intense monochromatic light source and detectors to measure a portion of the light that is scattered inelastically from the analyte molecule.

Basic Operation

Raman spectroscopy relies upon the change in polarization of a molecular bond that occurs when photons interact with the bond. The incoming photon interacts with the molecule and induces a dipole moment that in turn radiates a photon when the dipole moment it decays. The vast majority of these emissions are elastic. Elastic scattering, also known as Rayleigh scattering, accounts for the vast majority of scattered photons. In a small portion (about 1 in 107-108) of the scattered photons, the photon will have a shift in wavelength due to inelastic collisions called Raman scattering. Most of these energy-shifted photons have longer wavelengths than the incident radiation (known as a Stokes shift) but a small portion will have shorter wavelengths (known as an anti-Stokes shift).

Because Raman scattering constitutes such a small fraction of the scattered light, it produces a relatively weak signal. Raman Spectroscopy usually measures the Stokes shifted photons since they constitute the strongest signal. Although it is possible to measure the much weaker anti-Stokes shifted photons, the signal is almost always too weak for practical environmental monitoring applications. A typical Raman spectroscopy system uses a laser capable of producing intense, monochromatic light to generate a "packet" of scattered light that can be collected, dispersed through a monochromator, and processed to produce a spectrum. Like infrared spectra, Raman spectra are unique to a given compound and hence can be used to "fingerprint" or uniquely identify as well as quantify chemicals on a surface, in a liquid, or in air. Unlike infrared spectroscopy, the Raman technique is not affected by chemical species such as water, water vapor, and carbon dioxide that can "swamp out" infrared systems. Fluorescent molecules that are often present in the environment can interfere with Raman spectroscopy. There are, however, methods that will overcome fluorescent interference while maintaining a strong Raman signal.

Source

Because Raman scattering produces a very weak signal, the source must be very intense and monochromatic, which invariably requires a laser. Several types of lasers have been demonstrated for Raman use outside of a laboratory setting. Choosing the best laser depends on the application (distance to target compounds and media they are found in) and wavelength requirements for the target compounds. Note that the intensity of the Raman scatter is strongly affected by the wavelength of the incident light. The longer the wavelength, the less intense the scattering; therefore, blue and ultraviolet light produces the strongest Raman scattering. Shorter wavelengths translate to higher detection sensitivities.

Because lasers pose optical hazards to both operators and bystanders, OSHA safety standards for laser operation should be observed for safe operation. Laser operation requires significant training and should not be relegated to novice users.

Optics and Filters

Open path systems direct an appropriately chosen laser beam along the axis of a receiving telescope. The laser beam generally passes through a beam expander to reduce the possibility for eye damage. The scattered light is collected by a telescope or other focusing device and directed onto a filter. The filter rejects reflected stray laser light and the Rayleigh scatter leaving the Raman scatter to pass through a monochromator that separates the scattered light into individual wavelengths before directing it to a detection device. In laboratory settings double and triple monochromators are commonly used for Raman Spectroscopy. These systems reject the stray light and separate the scattered light with sufficient efficiencies to allow effective measurement of Raman spectra without using a filter.

Two types of filters are commonly used in Raman spectroscopy. The edge filter functions by blocking all the radiation below or above a specified wavelength and letting the remaining light through. The notch filter blocks the wavelength of incident radiation and a small area to either side therefore allowing the remaining light to pass through. Examples of notch filters include monochromator, absorption filters, dielectric filters, and holographic filters. Because of their wavelength specificity, cost, and ease of use, the latter two find most of their use in industrial process control where a known environment is constantly queried.

Spectrograph

A spectrograph separates the incoming light into its wavelength components and directs these onto a detector to quantify the amount of light at each wavelength. Several spectrograph designs are available, and each has strengths and weaknesses. Features to consider when selecting a design are the resolution required, the wavelength range(s) that needs to be captured, stray light treatment, and light throughput capabilities. A typical design has collimating optics that direct the incoming light onto a grating or prism, which separates it into component wavelengths. The wavelengths are reflected to a focusing mirror or other optic that directs them onto a detector. Other more-or-less complicated designs are possible.

Detector

Raman spectroscopy should have a detector with a wide dynamic range, all noise sources at levels below the shot noise, a wide wavelength range, and high quantum efficiency. Older devices used a photomultiplier tube. While these can still be used, they have been largely replaced by diode arrays and silicon charge-coupled-device (CCD) arrays. CCDs are the preferred arrays because of their ability to measure many wavelengths at once, and because they have a large wavelength range (400-1000 nm), large dynamic range, high quantum efficiency, low read noise, and low dark noise (Lewis and Edwards 2001). In order to enhance the sensitivity of this technology, an intensified charge-coupled-device (ICCD) can also be used. The intensifier, as the name implies, directly enhances the signal from any incoming light, which is important considering that the Raman signal is so weak. This device can also be "gated," which means that it can be automatically turned on and off to measure light scattered by the incident laser pulse. It also rejects background light and collects more of the Raman-scattered light, therefore enhancing its signal.

System Deployment

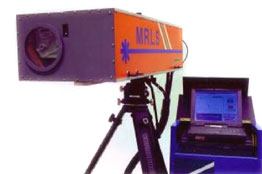
The most widely used open path Raman spectrometer directs the excitation light either into the atmosphere or onto a surface where the resultant dispersed light is gathered with collection optics. The power, pulse width, and frequency of the laser, as well as its wavelength help determine the effective range of the system. Portable systems generally fall under 50 meters (some as little as 3 or 4 meters), while large, fixed facilities, like the lidar units used for studying atmospheric conditions, can achieve 10 kilometers or more (at night).

Alternatives to Conventional Open Path Raman Systems

Fiber Optic-Based Raman Spectroscopy

Fiber optic-based Raman scattering has found strong application in a variety of industrial settings. The laser beam is directed into a fiber optic cable that carries it either to a probe immersed in the material to be analyzed (e.g., reaction vessel, gas stream) or to a flange window where it is focused onto the materials behind the window. Dispersed radiation is collected by a second fiber optic cable(s) and transmitted back to the receiving optics (if used) and onto the rejection filter. Although this configuration can allow for in-situ Raman scattering of industrial and environmental samples, it does require that the sample be in close proximity to the fiber optic; therefore, it lacks the remote sensing qualities of true open path techniques.

FT-Raman Spectroscopy

FT-Raman instruments are very similar to FT-IR instruments except that they have been altered to detect Raman scatter. (See open path FT-IR discussion in the open path focus area for a complete description of FT-IR.) Like FT-IR, they can be deployed in monostatic, bistatic, and passive configurations. A collimated, near-infrared laser beam is directed through a telescope to a receiving unit in the bistatic configuration, to a retroreflector in the monostatic configuration, and into open space in the passive configuration. The light is collected on receiving optics and directed to an interferometer. The interferometer produces an interferogram that contains all the spectral information collected by the instrument. The instrument's software performs a Fourier transform on the data and produces a field spectrum that is further manipulated to identify and quantitate individual compounds.

Lewis and Edwards (2001) list the advantages and disadvantages of FT-Raman compared with dispersive spectroscopy as follows:

Advantages

  • Long wavelengths limit the interference from fluorescence (especially for organics)
  • Interferometer properties
    • Fellget's (Multiplex)—collects signals from all wavelengths simultaneously
    • Étendue (Jacquinot)—amount of signal detected by interferometer is determined by entrance aperture, which does not have to be closed to improve spectral resolution as in a dispersive system
    • Conns—wavelength accuracy and precision are extremely good

Disadvantages

  • Multiplex occurs because the signal is being detected at all wavelengths simultaneously so shot noise from the entire spectrum is spread into every spectral element
  • Self absorption of the Raman light generated by the near-infrared laser source occurs

Resonance Raman Spectroscopy (RRS)

Resonance can be accessed when a laser energy is chosen that closely matches the electronic transition energy of a chromospheric group within the molecule(s) under study. The enhancement in the Raman signal is generally orders of magnitude better than regular Raman but only for those Raman bands directly associated with the chromosphere portions. The technique does not apply to all chemicals, and strong fluorescent interferences can occur.

Surface Enhanced Raman Spectroscopy (SERS)

When molecules are absorbed onto a uniformly roughened surface (generally gold, silver, or copper), they yield a Raman signal that is many times (102 to 106) more intense than normal Raman signals, and fluorescence from the analyzed species and other environmental species are quenched. Single molecules have been studied in the laboratory. The field deployment however, usually involves a fiber optic coupled wand where the gas phase species are drawn across a metal substrate and the absorbed chemicals are pulsed with a laser. In water applications, a sample of the water can be taken and a gel or colloidal suspension placed in it. The material is queried through the walls of the container. Alternatively, a fiber optic coupled probe containing the metal substrate can be placed in the water and a measurement taken directly.

Chemical Detection Limits

Basic open path Raman spectroscopy is capable of detecting a wide range of chemicals (both organic and inorganic) in the vapor, liquid, or solid phase. The detection limits depend upon the length of the path, the excitation wavelength used, and the Raman cross section of the individual chemical. Typical detection limits range from low ppm to percent levels but can be much lower with favorable enhancement of the cross section (i.e., SERS or RRS) and wavelength. Open path technology is generally not practical for trace analysis.

Demonstrated Uses in Environmental and Industrial Settings

This section offers examples of successfully deployed open path Raman spectroscopy analysis.

"Point and Shoot" Discrimination of Resins in Black Plastics

SpectraCode, Inc. has developed a laser probe that uses distributed focusing to bring sufficient radiation to bear on black plastics and obtain a Raman dispersion spectrum without causing the plastic to ignite. The Raman spectrum can identify the resin types in the plastic and its grade. This "point and shoot" instrument should enhance recycling of black plastics, such as those found in automotive uses (bumpers, instrument panels)(Purdue News, 2001).

Portable Raman "Point and Shoot" System for General Analysis of Chemicals and Drugs

In response to homeland security and drug enforcement needs, several manufacturers have developed portable Raman spectrometers with close range "point and shoot" capabilities. The instrument or attached fiber optic probe is placed against a bottle or clear plastic bag containing an unknown substance. The instrument will then identify the contents of the bottle or bag if it has a spectral reference for them. The probe can also be held just off a loose or spilled material to identify it. This technology is not for trace analysis and has been used by first responders and others to identify drugs and chemicals associated with drug making (e.g., the acids, bases, and chlorinated and non-chlorinated organic solvents used in methamphetamine production), chemical warfare agents, and explosives. Examples of this equipment are found on the Homeland Security sponsored webpage http://www.rkb.mipt.org/.

Meteorology and Pollution Events

Raman lidar is regularly used for meteorological purposes to measure range-resolved signals from molecular water vapor, molecular oxygen, and molecular nitrogen. It also can be used to provide a vertical profile of atmospheric temperatures that can be derived by comparing Stokes and anti-Stokes scattering.

Process Quality Assurance Quality Control

Raman spectroscopy, using fiber optics and either immersion or window probes, can query reactor vessels to determine if the desired quality of product has been produced. For example, if at the end of a reaction, one or all of the reactants are expected to have been converted to product, Raman can readily determine the status of the reaction and the concentrations of the reagents and products.

Uses Suggested in Vendor Literature

  • Identification of air pollutants using Raman lidar
  • Water vapor formation in meteorological studies using Raman lidar
  • Identification of automobile highway exhausts using Raman lidar
  • Chemical manufacturing process quality control (paper and pulp, pharmaceutical, petrochemical) using normal Raman
  • Quick identification of the plastic composition for recycling using normal Raman
  • Quick identification of organic chemicals on solids using "point and shoot" with short path length

Experimental and Potential Uses for Open Path Raman in Environmental and Industrial Uses

Process Monitoring for BTEX and Oxygenate Content of Petroleum Fuels

Cooper et al. (1997) demonstrated that Raman spectroscopy can be used for determining the BTEX content of petroleum fuels. The authors state that in other studies, they have used Raman for determining octane numbers and vapor pressures in commercial gasolines as well as oxygenate levels. While these laboratory experiments involved measurements through the walls of a glass vial, the authors conclude that Raman may be used in on-line process analysis of petroleum fuels, and in their experiments, it out performed near IR.

Measurement of Automotive Exhaust Emissions

The U.S. EPA funded a phase I small business innovation research grant to demonstrate the feasibility of using Raman spectroscopy to measure highway auto emissions. A UV Raman lidar instrument with a linear avalanche photodiode detector was developed for this purpose. The instrument has a range of approximately 10 meters. The instrument achieved the following detection limits: NO (120 ppm), N2 and CO (40 ppm), and NO2 and hydrocarbons (10 ppm). The detection limit for SO2 was expected to be in the low ppbs due to an enhanced Raman cross section. More information on the demonstration is available at: http://cfpub.epa.gov/ncer_abstracts/index.cfm/fuseaction/display.abstractDetail/abstract/1704/report/F

Experimental and Potential Uses for Other Raman Systems in Environmental and Industrial Uses

Corrosion Protection Analysis in Tanks Containing High Level Radioactive Waste

An in-situ probe that uses a fiber optic Raman spectroscopy probe has been developed by the Department of Energy to measure nitrate, nitrite, and hydroxide in tanks containing high-level radioactive wastes. These three chemicals are used to monitor and thus control tank corrosion. The system uses two 90-foot fiber optic cables to deliver a 670-nm laser beam to a probe in the tank. The system also retrieves the dispersed radiation for analysis with an echelle spectrometer attached to a thermoelectrically cooled CCD detector. DOE anticipates that the probe will save money by eliminating the need to physically draw samples from the tank for shipment to a fixed laboratory and will greatly reduce safety hazards associated with handling high-level radioactive wastes. The probe also allows more frequent querying of the tank contents, which improves the ability to keep the nitrite and hydroxide at optimum levels.

Chemical Warfare Agents in Water

The Army is developing a portable SERS-based instrument for measuring chemical warfare agents and their hydrolysis products in water (Christesen et al., 2002). It uses a near infrared laser source, compact spectrograph, and CCD array detector with a fiber optic coupled probe that can be placed in water. The prototype has been able to achieve ppb detection limits for VX (12 µg/L) and cyanide (1 µg/L) among other chemicals using electrochemically roughened gold and silver substrates.

The Department of Defense is funding (2006) the development of a SERS-based instrument that is capable of detecting and monitoring chemical and biological warfare (CBW) contaminants in water supplies. The portable, stand-alone prototype will be rugged and weigh less than 10 lbs.

Mine Detection

The Army is developing (2006) a mine sweeper that uses SERS for detection of trace-level gases that are given off by buried mines. The instrument has successfully detected TNT, 2,4-DNT, and 1,3-DNB at appropriate detection levels, but given the area that usually needs to be swept, improvements in read times must be made before it can be deployed.


Berkoff, T., D. Whiteman, R. Rallison, G. Schwemmer, L. Ramos-Izquierdo, and H. Plotkin. 2000. Remote detection of Raman scattering by use of a holographic optical element as a dispersive telescope. Optics Letters, Vol. 25, No. 16, p 1201-1203.

Carter, J., D. Stratis, S. Sharma, W. Scrivens, A. Trent Arcana, and S. Angel. 1999. Remote Raman using polymer mirrors. Pattern Recognition, Chemometrics, and Imaging for Optical Environmental Monitoring, Proceedings of SPIE ‑ The International Society for Optical Engineering, Vol. 3854, p. 9‑19.

Carter, J., D. Stratis, S. Sharma, and S. Angel. 1999.  Feasibility of remote Raman imaging using tunable filters. Internal Standardization and Calibration Architectures for Chemical Sensors.
Proceedings of SPIE ‑ The International Society for Optical Engineering, Vol. 3856, p 57‑69.

Chen, T. J. Madey, F. Price, S. Sharma, and B. Lienert. 2007. Remote Raman spectra of benzene obtained from 217 meters using a single 532 nm laser pulse. Appl. Spectrosc. 61, p 624-629.

Christesen, S., K. Ong, M. Womble, R. Clark, and R. Premasiri. 2000. Detection and identification of chemical agents in water using surface enhanced Raman spectroscopy (SERS) on gold and silver doped sol-gels. Proceedings of the 22nd Army Science Conference, p. 635-636. 

Christesen, S., M. Carrabba, and J. Bello. 2002. Nonintrusive Raman analysis of chemical agents. Vibrational Spectroscopy‑Based Sensor Systems, Proceedings of SPIE ‑ The International Society for Optical Engineering, Vol. 4577, p. 287‑293.

Christesen, S., M. Lochner, M. Ellzy, K. Spencer, J. Sylvia, and S. Clauson. 2002. Surface enhanced Raman detection and identification of chemical agents in water. Proceedings of the 23nd Army Science Conference.

Chyba, T., N. Higdon, W. Armstrong, C. Lobb, D. Richter, P. Ponsardin, B. Kelly, Q. Bui, R. Babnick, W. Marsh, and A. Sedlacek. 2002. Laser interrogation of surface agents (LISA) for standoff sensing of chemical agents. 21st International Laser Radar Conference (ILRC), Quebec, Canada, July 8‑12, 2002.  [Paper No: BNL‑69444‑AB].

Cooper, J., K. Wise, W. Welch, M. Sumner, B. Wilt, and R. Bledsoe. 1997. Comparison of near-IR, Raman, and mid-IR spectroscopies for the determination of BTEX in petroleum fuels. Applied Spectroscopy, Vol. 51, No. 11, p. 1613-1620. [abstract]

Cullum, B., J. Mobley, A. Wintenberg, R. Maples, D. Stokes, and T. Vo‑Dinh. 2002. Field‑portable AOTF‑based monitor technology for environmental sensing. Advanced Environmental Sensing Technology II, Proceedings of SPIE ‑ The International Society for Optical Engineering, Vol. 4576, p. 244‑254.

Esposito, S. and C. Philbrick. 1998. Raman/DIAL technique for ozone measurements. Proceedings of the Nineteenth International Laser Radar Conference, NASA/CP-1998-207671/PTI, p. 407-410.

Ferrare, R., S. Melfi, D. Whiteman, K. Evans, and R. Leifer. 1998. Raman lidar measurements of aerosol extinction and backscattering, 1. Methods and comparisons. J. of Geophys. Res., Vol. 103, No. D16, p. 19,663-19,672.

Higdon, N., T. Chyba, D. Richter, P. Ponsardin, W. Armstrong, C. Lobb, B. Kelly, R. Babnick, and A. Sedlacek. 2002. Laser interrogation of surface agents (LISA) for chemical agent reconnaissance. Chemical and Biological Sensing III, Proceedings of SPIE ‑ The International Society for Optical Engineering, Vol. 4722, p. 50‑59.

Kawai, N. and J. Janni. 2000. Chemical identification with a portable Raman analyzer and forensic spectral database. Spectroscopy, Vol. 15, No. 9.

Kumar, P. and J. Wehrmeyer. 1997. Pollutant detection for stack gases using laser Raman spectroscopy. Applied Spectroscopy, Vol. 51, p.849-855.

Lewis, I. and H. Edwards. 2001. Handbook of Raman Spectroscopy: From the Research Laboratory to the Process Line. Marcel Dekker, New York, NY.

Melfi, S., K. Evans, J. Li, D. Whiteman, R. Ferrare, and G. Schwemmer. 1997. Observation of Raman scattering by cloud droplets in the atmosphere. Appl. Opt, Vol. 36, No. 15, p. 3551-3559.

Moore, D. 2007. Recent advances in trace explosives detection instrumentation. Sensing and Imaging: An International Journal, Volume 8, Number 1, March, p 9-38.

Mulik, K. and C. Philbrick.  2000. Raman lidar measurements of ozone during pollution events. Proceedings of the 20th International Laser Radar Conference, Vichy, France, July 10-14, 2000.

Purdue University. 2001. SpectraCode breaks black plastics recycling barrier. Purdue News. http://www.purdue.edu/UNS/html4ever/010119.SpectraCode.recycle.html

Philbrick, C. 1998. Raman lidar capability to measure tropospheric properties. Proceedings of the Nineteenth International Laser Radar Conference, NASA/CP-1998-207671/PTI, p. 289-292.

Philbrick, C. 2002. Overview of Raman lidar techniques for air pollution measurements. Lidar Remote Sensing for Industry and Environment Monitoring II, Proceedings of SPIE ‑ The International Society for Optical Engineering, Vol. 4484, p. 136-150.

Privalov, V. and V. Shemanin. 2002. Lidar sensing of hydrocarbon molecules in the atmosphere. Second International Conference on Lasers for Measurement and Information Transfer, Proceedings of SPIE ‑ The International Society for Optical Engineering, Vol. 4680, p. 106‑111.

Ramirez, M., W. Ortiz, O. Ruiz, L. Pacheco-Londoño, and S. Hernández-Rivera. 2007. Detection of hazardous liquids concealed in glass, plastic, and aluminum containers. Sensors, and Command, Control, Communications, and Intelligence (C3I) Technologies for Homeland Security and Homeland Defense VI, Proceedings of the SPIE, Volume 6538.

Ray, M., A. Sedlacek, and M. Wu. 2002. Ultraviolet mini‑Raman lidar for stand‑off, in‑situ identification of chemical surface contaminants. Review of  Scientific Instruments, Vol. 71, p. 3485.

Sedlacek, A., M. Ray, N. Higdon, and D. Richter. 2002. Short‑range noncontact detection of surface contamination using Raman lidar. Vibrational Spectroscopy‑Based Sensor Systems, Proceedings of SPIE ‑ The International Society for Optical Engineering, Vol. 4577, p. 95‑104.

Sedlacek, A., M. Ray, and M. Wu. 1999. Augmenting classical DIAL with Raman-DIAL (RaDIAL).

Application of Lidar to Current Atmospheric Topics III, Proceedings of SPIE ‑ The International Society for Optical Engineering, Vol. 3757, p. 126-139.

Sedlacek, A. and N. Higdon. 2001. Laser Interrogation of Surface Agents: Lisa Joint Chemical Field Trial Test Report. DAAD09‑00‑P‑0241.

Sedlacek, A., M. Ray, S. Higdon, and D. Richter. 2001. Short-range noncontact detection of surface contamination using Raman lidar. Vibrational Spectroscopy-Based Sensor Systems, Proceedings of SPIE ‑ The International Society for Optical Engineering, Vol. 4577, p. 95-104.

Sharma, S.K., A.K. Misra, P.G. Anupam, R. C. Lentz, and C.H. Chio. 2007. Stand-off Raman instrument for detection of bulk organic and inorganic compounds. Chemical and Biological Sensing VIII. Edited by Fountain, Augustus W., III. Proceedings of the SPIE, Volume 6554.

Sharma, S.K., A.K. Misra and B. Sharma. 2005. Portable remote Raman system for monitoring hydrocarbon, gas hydrates and explosives in the environment. Spectrochimica Acta Part A: Molecular and Biomolecular Spectroscopy Volume 61, Issue 10, August 2005, Pages 2404-2412.

Spencer, K., et al. 1999. Advances in land mine detection using surface-enhanced Raman spectroscopy, Detection and Remediation Technologies for Mines and Minelike Targets IV, Orlando, Florida, SPIE Proceedings Vol. 3710, pp.373-379.

Spencer, K., J. Sylvia, S. Clauson, and J. Janni. 2002. Surface‑enhanced Raman as a water monitor for warfare agents. Vibrational Spectroscopy‑based Sensor Systems, Proceedings of SPIE ‑ The International Society for Optical Engineering, Vol. 4577, p. 158‑165.

U.S. DOE. 2002. Integrated Raman Sensor for In‑Tank Corrosion Chemistry Monitoring. Office of Science and Technology. Characterization, Monitoring, and Sensor Technology Crosscutting Program and Tanks Focus Area. Report No: DOE/EM‑0631, 30 pp, July 2002.

Voss, E., T. de Vries, H. Darpel, and A. Anders. 1998. Advantages of the coherent antistokes Raman scattering (CARS) in environmental monitoring and industrial process control. Environmental Monitoring and Remediation Technologies, Proceedings of SPIE ‑ The International Society for Optical Engineering, Vol. 3534, p. 75-82.

White, S.N.; W. Kirkwood, A. Sherman, M. Brown, R. Henthorn, K. Salamy, E. Peltzer, P. Walz, and P. Brewer. 2004. Laser Raman spectroscopic instrumentation for in situ geochemical analyses in the deep ocean. Oceans'04 , Kobe, Japan.

Whiteman, D., G. Schwemmer, T. Berkoff, H. Plotkin, L. Ramos-Izquierdo, and G. Pappalardo. 2001. Performance modeling of an airborne Raman water vapor lidar. Applied Optics, Vol. 40, No. 3, p. 375-390.

Whiteman, D. 2003. Examination of the traditional Raman lidar technique, I. Evaluating the temperature-dependent lidar equations, Applied Optics, Vol. 42, No. 15, p. 2571-2592.

Whiteman, D. 2003. Examination of the traditional Raman lidar technique, II. Evaluating the ratios for water vapor and aerosols, Applied Optics, Vol. 42, No. 15, p. 2593-2608.

Wu, M., M. Ray, K. Fung, M. Ruckman, D. Harder, and A. Sedlacek. 2000. Standoff detection of chemicals by UV Raman spectroscopy. Applied Spectroscopy, Vol. 54, p. 800.

Wu, M., M. Ray, K. Fung, M. Ruckman, D. Harder, and A. Sedlacek. 2000. Standoff detection of chemicals by UV Raman spectroscopy. Applied Spectroscopy, Vol. 54, p. 800.

Yan, F. and T. Vo-Dinh 2007. Surface-enhanced Raman scattering detection of chemical and biological agents using a portable Raman integrated tunable sensor Sensors and Actuators B: Chemical Volume 121, Issue 1, 30 January 2007, p 61-66.

Zhitov, A., I. Suprun, P. Belousov, and S. Ivanov. 2002. Application of Raman‑luminescent lidars based on UV lasers and image‑processing television systems in the remote sensing of atmospheric pollutants and ionization sources. Remote Sensing of Clouds and the Atmosphere VI, Proceedings of SPIE ‑ The International Society for Optical Engineering, Vol. 4539, p. 198‑204.

curve, top right
http://clu-in.org/programs/21m2/openpath/raman/default.cfm
Last modified: September 7, 2018