> Basic Operation
> Chemical Detection
> Demonstrated Uses in Environmental and Industrial Settings
> Experimental and Potential Uses in Environmental and Industrial Settings
> Passive Applications
> Environmental Technology Verification Program

Fourier transform a mathematical transform that allows an aperiodic function to be expressed as an integral sum over a continuous range of frequencies. (EPA) |
infrared the range of the electromagnetic spectrum between 0.75 µm (the long-wavelength limit of visible light) and 1000 µm (the shortest microwaves). |
incident spectrum the range of frequencies within which a wave impinges on a discontinuity or particle having different propagation characteristics. |
optical absorption coefficient mathematical factor attributing the uptake of light from radiation by the medium through which radiation is passing. |
wave number the number of waves per centimeter, also known as the reciprocal wavelength. Wave numbers for infrared spectroscopy range from 12,800 cm-1 (far infrared) to 10 cm-1 (near infrared). |
resistive use of the resistance of a filament to electrical current flow to generate heat. |
collimated the rendering of light waves to make them parallel in the same direction. This rendering minimizes their divergence and maximizes the amount of light that can be recovered by the instrument. Uncollimated light reduces the instrument’s resolution. |
electromagnetic waves disturbances produced by the acceleration of an electric charge and propagated by the periodic variation of intensities of perpendicular electric and magnetic fields. |
reflective property of a material that is capable of redirecting a light wave with minimum loss of energy, as in a mirror. |
refractive property of a material whereby a light wave is redirected through it with a change in speed and direction, as in a glass lens. |
Dewar flask a vessel having double walls, the space between being evacuated to prevent the transfer of heat, and the surfaces facing the vacuum being heat-reflective. |
cryogenic operating at very low temperatures (-160 to -50°C), commonly through the use of liquid helium or nitrogen. |
apodization a mathematical transformation carried out on data received from an interferometer to alter the instrument's response function (EPA). |
retroflector device used for retroflection, i.e., radiation returned in directions close to the direction from which it came (EPA). |
modulated varied in the amplitude, frequency, or phase of a wave. |
interferent water and CO2 strongly absorb in certain frequency ranges, making it difficult to determine if these absorbed frequencies have contributions from other chemicals. |
anemometers devices that measure the magnitude of air velocity. |
summa canister a polished, pressure-controlled container used to store calibration gas standards for transport to field sampling sites, and to store collected samples. |
Stirling engine an engine in which work is performed by the expansion of a gas at high temperature, whereby heat for the expansion is supplied through the wall of the piston cylinder. |
tomography the technique of making radiographs of plane sections of an object in order to show detail in a predetermined plane of the object, while blurring the images of structures in other planes. |
brightness temperature a measure of the intensity of radiation thermally emitted by an object. |
This section examines the basic operation of open path Fourier transform infrared (OP-FTIR) spectroscopy, provides examples of current uses, and suggests areas of potential use and research needs.
FTIR is the most versatile of the open path technologies because it can measure the presence of many chemicals in air simultaneously and can achieve relatively low detection limits (low parts per billion). Unlike LIDAR, which can measure one chemical or the presence of chemicals containing a common chemical bond at specific distances along the line of site, FTIR provides averages over set distances. Tunable diode lasers have similar detection limits as FTIR but are restricted to detecting chemicals that respond to the small frequency range in which they operate. Like FTIR, open path Raman spectroscopy is capable of measuring the presence of many chemicals and may achieve low detection limits; however, the very weak signal it measures can affect its resolution capabilities. The expected relative humidity of a site also can be a consideration when choosing between Raman and FTIR because Raman is insensitive to water vapor wereas water vapor is a strong interferent with FTIR.
Basic Operation
The following discussion is adapted from the U.S. EPA's FT-IR Open Path Monitoring Guidance Document (TR-4423-99-03).
Beer's Law is the fundamental physical law that forms the basis for all FTIR data analysis. It states that for a constant path length, the intensity of the incident (direct) light energy traversing an absorbing medium diminishes exponentially with concentration. The FTIR instrument measures intensity in the infrared (IR) spectrum, and it can use the intensity signature of the returning incident spectrum, along with Beer's law, to identify and quantify compounds. For a rigorous discussion of Beer's Law and its relation to FTIR, see USEPA 1999a, pages 2-17 to 2-19.
FTIR open path measurements can be made using an active or passive approach.
Two configurations can be used in the active approach. With the monstatic configuration (Exhibit 2), an instrument focuses a light beam before passing it through an interferometer (see discussion below). The interferometer converts the light beam into a modulated signal as a function of optical path difference (interferogram). The encoded light beam then passes from the sending optics across the area to be measured for contaminants to mirrors that reflect the signal back across the measurement area to receiving optics and onto a detector, which records it. The recorded signal is mathematically manipulated using a Fourier transform technique to produce a spectrum that can be used to identify specific contaminants and their concentrations.
In the bistatic configuration (Exhibit 3), the encoded light beam passes from the sending optics through the area to be measured for contaminants to receiving optics and onto a detector, which records it. As with the monostatic system, the recorded data is manipulated to produce a spectrum that can be used to identify specific contaminants and their concentrations.
The passive approach has no sending unit; instead, the instrument uses an external energy source to provide the infrared light. Receiving optics focus the light into the interferometer, which encodes them into an interferogram format, that then is directed onto a detector for recording. As with the active approach, the recorded signal is mathematically manipulated using a Fourier transform technique to produce a spectrum that can be used to identify specific contaminants and their concentrations.
Source
The active IR source is a resistive arrangement that usually heats to between 1,000 and 1,800 C. The light given off by the source (active or passive) must be collimated before it is introduced into the interferometer. For active systems, the ability of the collimating optics to focus the light will determine the instrument's effective range. Depending upon the deployment scheme, maximum range for an active source OP-FTIR system is approximately 1,000 meters; 500 meters is more commonly attained.
Interferometer
The interferometer is the mechanism that allows the OP-FTIR system to perform. A simple Michelson interferometer consists of a beam splitter, a stationary mirror, and a moving mirror, with a path that is perpendicular to light reflected from the stationary mirror (Exhibit 1). Collimated light enters the interferometer, where it is split into two beams. One beam is directed to the stationary mirror, while the other is directed onto the moving mirror. The returning beams recombine at the beam splitter, where half return to the source and half transmit through the target area to the detector. The moving mirror light causes a pattern of destructive and constructive interference with the stationary mirror light, forming the basis for an interferogram pattern. The use of a reference laser determines the exact position of the moving mirror at any given time. The encoded beam contains all frequencies of the original source light, and as the beam moves through the target area, contaminants absorb frequencies characteristic of their molecular structure. The detector records intensities versus time (optical retardation), creating a time domain spectrum (interferogram). Application of a Fourier transform to the time domain data obtains a wavelength or frequency spectrum. For an explanation of interference and its role in FTIR see section 2.2, pages 2-3 in USEPA 1999a.
Exhibit 1. Simple Michelson Interferometer
The construction of the interferometer affects the instrument's resolution. EPA defines resolution as the minimum separation that two spectral features can have and still be distinguished from one another (USEPA 1999a). Resolution is inversely related to the maximum optical path difference, in centimeters, of the two interferometer mirrors employed in the interferometer. The closer the spectral features of chemicals of interest, the greater the optical path difference required before they can be resolved, and the longer the measurement will take. The higher the resolution, however, the higher the signal-to-noise ratio, which forces a tradeoff between better resolution and baseline noise. The optimum resolution for a given application is site- and chemical-specific (See chapter 7 of USEPA 1999a for a more complete discussion). Common spectral resolutions are 0.125, 0.25, 0.5, 1.0, 2.0, 4.0, 8.0, and 16.0 cm-1. The smaller the number, the higher the resolution.
Low or inadequate resolution can have the following effects:
- Distort the true absorption spectrum, leading to misidentification of the chemical species.
- Obscure the quantitative relationship between absorbance and concentration, thus decreasing accuracy.
- Diminish the resolution of spectral overlap such that two close but distinct absorption wavelengths that are characteristic of two different chemicals look like one.
EPA recommends a resolution of at least 1.0 cm -1 for trace organic analysis (USEPA 1999b). Note, however, that for some applications a lower resolution may be appropriate.
Optics
The transmitting and receiving optics are generally Cassegrain or Newtonian telescopes (USEPA 1999a). For purposes of the OP-FTIR system, their optics are essentially identical. The main difference is that light exits the Cassegrain through the rear of the instrument, whereas it exits the Newtonian at an angle perpendicular to the main body. The optics in either system should be reflective rather than refractive to avoid transmission losses.
Detector
A semiconductor device made of mercury, cadmium, and telluride, commonly called an MCT detector, provides detection in most OP-FTIR instruments used for monitoring atmospheric pollutant gases. Of the three modes in which the semiconductor device can be operated, the MCT photoconductive detector is the one most often used in the OP-FTIR instrument.
Other types of semiconductor materials may provide better performance for special uses. For example, indium-antimonide (InSb) has an advantage with higher wave numbers that makes it useful for the measurement of hydrogen fluoride.
Semiconductor detectors in OP-FTIR monitoring systems must be cooled to operate properly. The first of two currently used cooling techniques places the detector in a Dewar flask that uses liquid nitrogen as a refrigerant. For this mode, a supply of liquid nitrogen (a few pints a day) must be available for use in the field, and the operator must fill the Dewar periodically. The second cooling technique employs a cryogenic cooler (e.g., Stirling cooler).
Deuterated triglycine sulfate (DTGS) detectors can also be used in FTIR systems. DTGS detectors operate at room temperature, which provides an operational advantage over the cooling requirement for MCT detectors and also decreases costs. On the other hand, DTGS detectors are less sensitive (i.e., have higher detection limits) than MCT detectors and respond much more slowly.
Output
Considerable manipulation of the raw data is required to generate concentration-length spatial and temporal data for the end user. The interferogram represents the basic data product of an OP-FTIR instrument; however, the mechanics of the instrument can alter the interferogram, and this influence should be taken into account in the data analysis. The interferogram displays the intensity measured by the detector as a function of the moving mirror. In actual operation, the mirror in the interferometer moves only a few centimeters, stops, and returns to its original position. This finite movement truncates the interferogram at each end. The truncation broadens the spectral line features and adds oscillations (lobes) into the wings of the spectral features. The suppression of these lobes is known as apodization. Several apodization functions are available (e.g., triangular, Happ-Genzel, Norton-Beer). The apodization technique should not be selected randomly as the effects on the spectral features vary depending upon the technique.
Following any spectral corrections on the interferogram, the instrument software will perform a Fourier transform on the interferogram time domain data to produce a single beam (field) spectrum as a function of frequency or wavelength. Dividing the field spectrum by a background spectrum yields a transmission spectrum, and taking the negative logarithm of the transmission spectrum identifies and quantitates the target analytes. Ideally, the background spectrum is collected under the same experimental conditions as those for the field spectrum, but without the presence of the target analytes. EPA identifies four methods (USEPA 1999a) to collect background:
- Synthetic. Synthetic background spectra can be generated by selecting data points along a field spectrum and applying a mathematical equation that best fits the selected points, or by successive subtraction of the spectral features due to interfering species. This method can introduce errors and requires an experienced operator.
- Upwind. The upwind background method predominates at smaller sites where it is practical to move the system from one side to another. The system is set up so that the path is along the upwind side to allow the acquisition of a background spectrum. This procedure is usually performed twice a day—morning and evening (USEPA 1999b).
- Cross Path. When the geometry of the site allows it and target gas concentrations are supposed to be absent, the cross-path background is taken with an optical path placed along one side of the site with the wind velocity parallel to it; however, the operator has no guarantee against interference from a non-site source of target compounds upwind that may drift into the path (USEPA 1999b).
- Zero Target Gas. Background samples also can be obtained when the target analytes are not expected to be in the air. This method will not work for compounds commonly present in the atmosphere, such as nitrous oxide and carbon monoxide, and so will not be useful in all cases.
The amount of water vapor in the air will affect the validity of any background measurement. If the water vapor content at the time a field spectrum is taken differs significantly from water vapor content during generation of the background spectrum, then a new background spectrum must be acquired. Water vapor interferes in OP-FTIR measurements, as does CO2. Relative humidity, temperature, and wind direction should be continuously monitored.
The final step is the mathematical comparison of the absorption spectrum to reference spectra for identification and quantification. Reference spectra for target compounds can be generated in the field; however, both government and commercial spectral libraries are available for use. The National Institute of Standards and Technology (NIST) has two infrared databases—a limited one specifically developed and designed for open path (see table below) and one that combines the EPA database for IR with the one developed by NIST (contains about 350 spectra). The absorption spectra generally are fitted to the reference spectra through use of classical least squares regression analysis, which is the method used for EPA Method TO-16 in preference to other analytical algorithms, such as partial least squares, iterative least squares, and principal component analysis (USEPA 1999b).
| NIST IR Available Spectra |
| Acetone |
Chloroform |
Ethyl Acetate |
Propylene Oxide |
| Acetonitrile |
Dichlorofluoromethane |
Ethylbenzene |
Sulfur Dioxide |
| Acrylonitrile |
1,2-Dichloroethane |
Ethyl t-Butyl Ether |
Sulfur Hexafluoride |
| Benzene |
1,1-Dichloroethene |
Ethylene Oxide |
Tetrachloroethene |
| Bromomethane |
Dichloromethane |
Hexafluoroethane |
Toluene |
| 1,3-Butadiene |
1,2-Dimethylbenzene |
Methanol |
1,1,1-Trichloroethane |
| Butane |
1,3-Dimethylbenzene |
Methyl t-Butyl Ether |
1,1,2-Trichloroethane |
| 1-Butanol |
1,4-Dimethylbenzene |
Methyl Ethyl Ketone |
Trichloroethene |
| Carbon Tetrachloride |
Ethanol |
Pentafluoroethane |
Vinyl Acetate |
| Carbon Tetrafluoride |
Ethene |
2-Propanol |
|
Deployment
OP-FTIR instrumentation can be deployed in three configurations: monostatic, bistatic, and passive. In the monostatic configuration (Exhibit 2), an active IR source travels through the interferometer and transmitting optics and then passes through the source to be measured; a mirror or retroreflector sends it back through receiving optics to a detector, which produces an interferogram. The interferogram is then mathematically manipulated to generate an absorption spectrum. This spectrum is further manipulated to fit it against a spectral library for identification and quantitation. The monostatic configuration can be set up to use a single telescope as the transmitting and receiving optics, or it can use separate telescopes for transmitting and receiving the IR signal. Using the single telescope configuration necessitates the addition of a second beam splitter. Since even the most effective splitters transmit only 50 percent of the emission, putting the signal through two splitters reduces the effective signal strength to 25 percent of its original strength and radically affects the detection limits of the method. The monostatic configuration has several advantages:
- It requires one power supply.
- The retroreflector effectively doubles the travel distance of the light beam. For small plumes this allows the averaging to take place over a smaller true distance than might be required for detection limit attainment with one pass.
- Retroreflectors can be distributed across a site or at various distances and heights along a fence line to locate hotspots and provide the flux of a plume leaving a site.
Exhibit 2. Monostatic Configuration for Open-Path FTIR
In the bistatic configuration (Exhibit 3) the source lies at one end of the path and the detector at the other. Two methods can be used to deploy the system. The first method places the IR source, interferometer, and transmitting optics at one end of the path and the receiving optics and detector at the other end. This configuration allows modulation of the IR beam along the path, which permits the system's electronics to reject unmodulated background radiation (black body radiation). The second configuration places the IR source and transmitting optics at one end of the path and the receiving optics, interferometer, and detector at the other end. The disadvantage to this configuration is that no early modulation of the IR source occurs; hence, the system's detector processes both the IR source and any background radiation. The background radiation must subsequently be subtracted from the measurement. When the path that needs to be measured is long (e.g., a large facility fence line), the bistatic configuration is advantageous in that the light transverses the measurement area only once, and less light is lost than with a monostatic system.
Exhibit 3. Bistatic Configuration of Open Path FTIR
In the passive configuration (Exhibit 4), the OP-FTIR consists of receiving optics, an interferometer, a detector, and a computer for processing the data. The infrared source is generally the sun (absorption) or a preheated plume (emission), or hot buildings or process equipment. The mathematics required of this configuration is different than those with an active source, as the ability to identify and quantitate chemicals depends upon the theory of radiative transfer. This means that the probability of detection depends upon the temperature of the cloud or plume of chemicals and the brightness temperature of the background (theory of radiative transfer). Temperature contrast usually is not a problem for an emission plume, because stack gases tend to be much warmer than ambient air (e.g., clear sky); however, for emissions close to the temperature of ambient air, a different background than clear sky may be needed. The sensitivity (detection limits) of the passive method is generally less than that of the active method, but the effective range is longer (up to several kilometers).
Exhibit 4. Passive Configuration of Open Path FTIR
Chemical Detection
An OP-FTIR can detect most gaseous chemical compounds. Exceptions include noble gases, vapor-phase metals, and homonuclear diatomics (e.g., O2, N2, Cl2). The detection limits achievable by an instrument depend upon a number of factors, such as the instrument itself, mode of deployment, humidity, and the distance traversed. Water vapor is a strong interferent. In general, achieving the optimum detection limits requires a path length of at least 100 meters. Exhibit 5 shows lower detection limits for active systems from two vendors. Project-specific detection limit estimates for a variety of contaminants can be found in Evaluation of a Former Landfill Site in Fort Collins, Colorado, Using Ground-Based Optical Remote Sensing Technology.
Exhibit 5
Vendor-Published Lower Detection Limits for Selected Compounds |
| |
Bruker1 |
Industrial Monitoring and Control Corporation2 |
| Compound |
1 meter
(ppm) |
450 meters
(ppb) |
300 meters (ppb) |
| Acetone |
10 |
3 |
30 |
| Acrolein |
|
5 |
5 |
| Ammonia |
1.5 |
1 |
1 |
| Benzene |
|
7 |
20 |
| 1,3 Butadiene |
|
|
1 |
| Carbon Monoxide |
2 |
1 |
1 |
| Carbon Tetrachloride |
0.5 |
0.6 |
2 |
| Chlorobenzene |
|
3 |
10 |
| Chloroform |
|
1 |
2 |
| Ethane |
|
2 |
10 |
| Ethene |
|
|
1 |
| Formaldehyde |
0.5 |
2 |
1 |
| Hydrochloric Acid |
|
|
1 |
| Isobutane |
|
0.7 |
2 |
| Isobutene |
|
|
4 |
| Methane |
1 |
1 |
|
| Methanol |
|
|
4 |
| Methylene Chloride |
|
2 |
5 |
| Methyl Ethyl Ketone |
|
4 |
40 |
| Nitrous Oxide |
1.3 |
0.7 |
|
| Ozone |
0.5 |
6 |
3 |
| Propene |
|
|
4 |
| Sulfur Dioxide |
0.4 |
2 |
30 |
| 1,1,1,2 Tetrachlorethane |
|
3 |
4 |
| 1,1,2,2 Tetrachlorethane |
|
4 |
20 |
| Tetrachloroethene |
0.6 |
2 |
2 |
| Toluene |
|
7 |
25 |
| 1,1,1-Trichlorethane |
|
1 |
4 |
| Trichloroethene |
0.4 |
4 |
2 |
| Vinyl chloride |
|
3 |
|
| m-Xylene |
|
4 |
10 |
| o-Xylene |
|
4 |
20 |
| p-Xylene |
|
4 |
20 |
1 0.5 cm-1 resolution OPS System
2 IMACC Web page FAQs http://www.ftirs.com/IndustrialSolutions/FAQ.aspx
Demonstrated Uses in Environmental and Industrial Settings
This section offers examples of successful FTIR implementation for open-path monitoring.
Hotspot and Flux Measurements from Capped Landfills
Regardless of whether a monostatic, bistatic, or passive configuration is chosen, OP-FTIR measurements render averages over the length of the light path (path-averaged concentrations). In fence-line monitoring, averages create the potential for underestimating concentrations of target analytes that originate from a point or areally small source. When using single-beam fence-line monitoring, wind or temperature conditions may cause the bulk of the contaminant plume to exit the site above the monitoring line and avoid detection. Given unfavorable wind or temperature conditions, the project manager may consider a monostatic configuration with multiple retroreflectors distributed at set distances and heights across the entire length of the path (Exhibit 6). When measurements are taken from each of the path lengths, simple subtractions can be made to isolate higher concentration areas. Alternatively, more sophisticated computed tomography techniques can be applied to image the concentrations. (For a discussion of tomography, see Hashmonay et al. 1999.)
Exhibit 6. Monostatic Configuration with Multiple Retroreflectors
The Measurement and Monitoring Initiative sponsored two projects to demonstrate the use of open path technologies for locating gaseous hotspots at closed landfills and for determining contaminant fluxes leaving the landfill property.
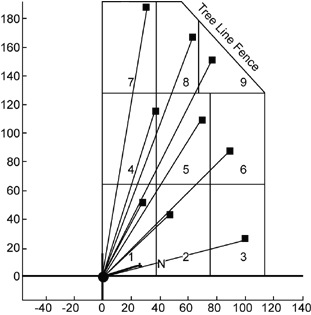
In the first project, an open path FTIR radial scanning method (Exhibit 7) was used on a 27-acre landfill that operated from the mid-1930s to 1975. The city has a reuse proposal to build soccer fields on the site if it can be shown that no gaseous emissions are escaping from the cap. The survey identified a methane hotspot that was subsequently repaired and provided concentration contour maps of fugitive methane emissions across the landfill. Even with detection capabilities of parts per billion, no other chemicals were found. By performing a vertical plane measurement at the up- and downgradient sides of the landfill, a total methane flux off the site was calculated. (See Measurement of Fugitive Emissions at a Region I Landfill, EPA-600/R-04-001.)
The second project evaluated open path FTIR spectrometers, open path tunable diode laser spectrometers, and open path differential optical absorption spectrometers at two former landfills in Colorado. The evaluation utilized the radial plume mapping technique that deploys the instruments in multiple-beam configurations. The tests also included new software algorithms that plot contaminant fluxes in real time. The investigators evaluated contaminant emissions at a recreational area that encompassed a former five-acre municipal landfill in Fort Collins, Colorado. The survey indicated an absence of methane hotspots, and concentration fluxes across the landfill were essentially at background. A gasoline hotspot (maximum concentration of 100 ppb with a 0.87 g/sec flux) was detected near a recreational building, and a methanol hotspot (maximum concentration of ≤127 ppb) was found within the property fence line. The survey detected a methane/ammonia plume from an offsite source by the downwind vertical configuration. (See
Evaluation of a Former Landfill Site in Fort Collins, Colorado, Using Ground-Based Optical Remote Sensing Technology.)
Exhibit 7. Radial Scanning Array
The second site investigated comprised a 40-acre landfill that operated between about 1957 and 1980. Several volatile organic compounds (VOCs) are known to be present in soil gas and groundwater beneath the landfill. Both horizontal and vertical surveys were performed that located two methane hotspots. These hotspots contributed to the 4.9 g/sec flux rate that was calculated at the downwind side of the site. The surveys detected no VOCs or ammonia. (See Evaluation of Fugitive Emissions at a Former Landfill Site in Colorado Springs, Colorado, Using Ground-Based Optical Remote Sensing Technology.)
In addition to the above site demonstrations, Guidance for Evaluating Landfill Gas Emissions from Closed or Abandoned Facilities presents two approaches for evaluating ambient air impacts of landfill emissions. The first, more traditional approach combines survey instruments (PID and FID) with canister sampling and subsequent GC/MS analysis. The second approach uses radial open path FTIR. The manual also discusses various models developed with data from the traditional approach, followed by sampling and evaluation methods for subsurface migration of vapors. The subsurface migration discussion also covers indoor air intrusion issues. Another section addresses stack sampling of gas emissions control equipment.
Gas Emissions from Capped Landfills Using Non-Radial Methods
An OP-FTIR vendor (I-CORP) has constructed an 8-foot open path sample cell that can be mounted on the front of a vehicle. Depending on how many readings are taken per second, the instrument is capable of detection limits down to 0.1 ppm. The vehicle traverses the capped area taking continuous readings that are correlated with an on-board GPS. This survey produces a concentration map of target analytes. The map provides a reasonable idea of the location of breaches in the cap that allow gases out and liquids in.
The Brantley Landfill Superfund site is a former strip mine filled with secondary aluminum recovery salt cake fines. These fines contain sodium and potassium chloride salts, metals, nitrides, and carbides that, when wetted, will produce ammonia gas. A remedy that included capping and grading the landfill was completed in 1998. In 2000, an OP-FTIR survey showed that downwind emissions were an order of magnitude below any applicable threshold or ARAR-evidence that the cap was keeping ammonia gases to an acceptable level (USEPA 2002b).
Environmental Fence-Line Monitoring at a Refinery
An OP-FTIR fence-line monitoring system has been in operation at the Conoco Phillips-Rodeo (formerly TOSCO) refinery in Rodeo, California, since 1997. The system consists of two monostatic OP-FTIR configurations deployed along the north and south fence lines of the plant. The one-way optical path of the north fence line is 930 m long and the south path is 955 m. The systems are set to monitor on a frequency of every five minutes and to sound an alarm if concentrations of some 26 target compounds exceed pre-set concentration levels (ppm/m level). A monthly report evaluates system performance and summarizes the chemicals detected, their concentrations, and the system detection limit for them. The system contains a spectral library of over 300 chemicals. Electronic preservation of the collected monitoring spectra allows the spectra from any monitoring period to be re-examined for the presence of other than target chemicals. (See Pawloski and Iverson 1998 and Contra Costa County Health Services website at http://www.fenceline.org/rodeo/data.php.)
A more recent study of refinery monitoring in the San Francisco Bay area can be found in Fujita and Campbell, 2013.
Compliance Monitoring at an Industrial Wastewater Treatment Plant
Tinker Air Force Base in Oklahoma replaced a fugitive emissions point source system with an OP-FTIR system to monitor their wastewater treatment plant. The OP-FTIR system monitors for 20 target chemicals (including perchloroethene, trichloroethane, methylene chloride, and phenols) and has a reference library of over 100 chemicals. The system uses one sending and receiving unit and multiple retroreflectors. It is programmed to automatically cycle through the different optical paths. A weather station provides current meteorological data, which are analyzed with the data from the OP-FTIR to provide real-time plume definition.
Environmental Open Path Monitoring During Remedial or Removal Actions
Prior to remediating dioxin-contaminated soils at Times Beach, Missouri, a source of monoaromatic contamination (ethylbenzene, toluene, and xylenes) in soil was discovered. Planners decided that fence-line monitoring should be performed during the dioxin remediation to ensure that harmful concentrations of vapors from the monoaromatics were not escaping the site. The OP-FTIR system chosen to perform this monitoring was deployed in a monostatic configuration that used both flat mirrors and retroreflectors. Stop-work levels were set at 10 ppm for toluene and 20 ppm for the other compounds of interest. The monitoring instrument contained a QA gas cell 0.15 meters in length. Despite the very short path length, the use of sulfur hexafluoride and butane as standards allowed the instrument to be checked daily to verify its normal function. At no time during the remediation of these soils were the action levels exceeded. Without the use of the OP-FTIR, the project would have had to initiate constant engineering controls that would have increased remediation costs (Taylor and Brunnert 1999).
In 1993, an emergency removal action was carried out at the Michigan Avenue Dump Site in Canton, Michigan. The material to be excavated and removed contained volatile organic chemicals. EPA Region V personnel were concerned that fugitive emissions from this operation might affect off-site residents and personnel. An OP-FTIR system deployed in a monostatic configuration was selected for perimeter monitoring and set up so that all four sides of the site could be monitored by one instrument. From instrumentation placed in the northwest corner of the square, the north and west sides were measured by direct transmission of light to retroreflectors placed at the southwest and the northeast corners of the site. Flat mirrors also were placed at these corners. In separate measurements to measure the south and west sides, these mirrors conducted light to two retroreflectors located at the southeast corner of the site that returned the light via the mirrors to the detector. During the 11-month action, exceedances occurred that stopped work while vapor suppression actions were taken; however, without the OP-FTIR system, the work would have had to be performed under an enclosure at much greater cost to the potentially responsible parties (Minnich and Scotto 1999).
Natural and Ambient Pollutant Monitoring
Stoner, et al. (1999) reported on the use of OP-FTIR to monitor gases escaping from a thermal spring in Yellowstone National Park. IR spectra collected over an open spring and over an area with microbial mats indicated higher concentrations of methyl acetate, acetate, and methanol over the mats than over the open spring. Methane was not detected above ambient levels, but there appeared to be periodic methyl mercaptan blooms over the mat area. These results suggest that OP-FTIR should prove useful in investigating random intermittent chemical releases in a natural setting for which traditional grab or time-averaged techniques would not provide accurate measurements.
OP-FTIR has been shown to provide measurements of ambient pollutant values in the air at a highly frequented recreational area. Using an OP-FTIR in a monostatic configuration, over a path length of 388 m, Ropertz et al. (1999) determined ambient concentrations of carbon monoxide, methane, nitrous oxide, ozone, ammonia, and other chemicals at a recreational lake in Germany. While employing other instruments (UV-DOAS) for comparison, the investigators also used numerous meteorological measurements to aid in the data evaluation. Three weather stations recorded temperature, humidity, pressure, wind speed, wind direction, global radiation, and precipitation. Two anemometers were used to obtain turbulence measures. By evaluating the concentrations from the open path instruments along with the meteorological data, the authors were able to determine the flux of the contaminants over time.
Uses Suggested in Vendor Literature
Numerous vendors manufacture OP-FTIR equipment. The following list identifies successful deployments claimed by vendors in their sales literature:
- Monitoring industrial fugitive emissions, both fence-line and process/storage.
- Monitoring stack plumes for Clean Air Act criteria pollutants and hazardous air pollutants.
- Remote sensing of aircraft emissions.
- Monitoring ambient air quality.
- Monitoring airport air quality.
- Monitoring urban air quality.
- Monitoring indoor air at manufacturing plants for industrial hygiene purposes.
- Monitoring industrial flares.
- Monitoring remediation activities for personnel and public safety.
- Monitoring for chemical warfare agents.
- Monitoring for releases at offshore oil and gas drilling operations.
- Monitoring of gases emitted by volcanic eruption.
Experimental and Potential Uses in Environmental and Industrial Settings
This section provides summaries of research applications and suggests potential uses of OP-FTIR in environmental and industrial areas.
Indoor Air
The migration of contaminants in groundwater to indoor air, either through openings in basements or through cracks in foundation slabs, is an area of growing concern in indoor air monitoring. The current standard method for confirming if indoor air has been impacted calls for air collection via a summa canister over a 24-hour period, followed by GC/MS analysis in the laboratory. OP-FTIR has been employed by industrial hygienists to monitor the quality of ambient indoor air in manufacturing facilities but has not been widely used in monitoring indoor air in office buildings or houses. With a monostatic configuration and several folding retroreflectors, an OP-FTIR system can obtain very low detection limits and provide a virtually continuous 24-hour record of the average concentration of target compounds in a basement. While the summa canister approach gives an average concentration over 24 hours from an extractive point source, the OP-FTIR could measure the room average every few minutes. From these measurements, it would be possible to determine if the concentrations fluctuate with different outside temperatures and changes in barometric pressure as well as maximum and minimum concentration levels. While the health-based concentrations for some chemicals are very low (e.g., TCE), newer OP-FTIR instrumentation may be able to attain these levels. While the health-based concentrations for some chemicals are very low (e.g., TCE), newer OP-FTIR instrumentation may be able to attain these levels. Many indoor air investigations require measuring upwind background chemical concentrations. OP-FTIR systems can give background readings across many structures rather than using a point source that might not be representative of contamination.
Digital Filtering of Interferograms to Isolate Target Chemicals in Overlapping Spectra
Idwasi et al. (2001) reported on research for the Department of Defense to develop a passive portable OP-FTIR. Their work focused on developing digital filtering methods that would allow for the detection of a target compound coexisting with one or more other non-target compounds with strong overlapping spectra. The experiment used an ethanol in ammonia mixture that varied the amount of ethanol (405 to 0 ppm/m) present in the vapor cloud while keeping the amount of ammonia (around 170 ppm/m) constant. The technique segments an interferogram into areas of spectral interest and then applies a digital filtering algorithm to obtain the specific spectra of interest. The researchers found that an interferogram segment of at least 120 points and two digital filtering passes provided the best results. They speculated that a segment larger than 120 points would provide even better detection sensitivity, but achieving it would require the development of a better numerical optimization strategy. Future work will focus on developing this strategy.
Volatile Organic Releases from Landfills into the Vadose Zone
OP-FTIR can be deployed only during new construction of a landfill. The concept places perforated PVC pipes laterally beneath the bottom liner of a landfill, with an access gallery constructed perpendicular to these pipes. Retroreflectors are mounted on one side, with sufficient space on the other side to set up a coaxial OP-FTIR. The pipes are monitored periodically for the presence of volatile organic gases. The long-term expense of bringing an experienced operator and OP-FTIR equipment on site to perform the measurements presents a potential drawback.
Industrial Plant Site Monitoring
OP-FTIR has been proposed as a method for remote monitoring of industrial plants. This application differs from fence-line monitoring because the objective is not to determine what is leaving the plant property but to determine if detectable releases occur in specific locations at a plant site (e.g., drum storage area) or for specific processes (e.g., cracking unit at a petroleum refinery). Although OP-FTIR units are expensive, the careful choice of retroreflector locations may reduce the number of units needed to monitor areas of concern. A bistatic configuration would be too expensive due to of the number of detector units needed and would be complicated by the need to find safe places to set them up.
Monitoring of Phosphine in the Vicinity of Tobacco Storage Facilities
Phosphine and other fumigants (e.g., methyl bromide) are routinely used to destroy potential pests at agricultural storage facilities. Thorn et al. (2001) reported on the use of OP-FTIR to measure average concentrations of phosphine outside a tobacco storage facility. Six paths measured along the warehouses, each averaging 50-100 m, detected no phosphine at an average detection limit of 0.13-0.25 ppm. One measurement made in front of a door following fumigation and immediately after aeration detected up to 8.3 ppm of phosphine. Another measurement taken inside one of the warehouses after aeration found 4 ppm of residual phosphine. The authors believe OP-FTIR provided a better, more cost-effective picture of the presence of phosphine than point source monitoring.
Passive Applications
OP-FTIR is used in passive applications when it is inconvenient or impossible to place a retroreflector or detection unit behind the target area; however, a passive unit is less sensitive than an active unit and requires a greater temperature difference between background and the target plume to allow for measurement. The temperature differential requirement makes it very apt for stack emissions. See Beil et al. (1998) for a discussion of the technology.
Harig et al. (2001b) present a general discussion of a passive technique and provide two specific applications. The first application shows a scanning OP-FTIR system used by a fire brigade in Hamburg, Germany (Exhibit 8). This system provides both a spectral analysis in ppm and a video visualization depicting different concentration levels that allow chemical hazards at fire sites to be ascertained. In the second application, the same type of instrumentation (i.e., capable of both visualization and quantitation) is used to examine ammonia vapor concentrations coming off a meadow on which liquid manure has been spread. Harig and Matz (2001a) also provide a discussion of the second system.
Exhibit 8. Hamburg Fire Brigade Portable Scanning FTIR
Source: Harig et al. 2000b.
The Harig technology was acquired by Bruker and is commercially available. Exhibit 9 shows a new version of the system.
The U.S. EPA airborne spectral photometric environmental collection technology (ASPECT) program employs an on-call emergency response aircraft equipped with an IR imager and an FTIR spectrometer. The imager, a high spatial resolution multispectral line scanner, produces 2-D images of chemical-specific plumes that can be overlain on a ground-surface image in real time. This capability alerts emergency response personnel to the exact location of a plume. In addition, the FTIR spectrometer quantifies the concentrations of individual chemical species in a plume, which allows ground personnel to take appropriate action to remain safe.
The solar occultation flux (SOF) method was developed in Sweden for measuring fugitive emissions from chemical plants and refineries. It measures the infrared intensity spectra of the sun from a moving platform (e.g., vehicle or ship). The vehicle places the emissions plume between the FTIR instrument and the sun. The flux is then obtained by multiplying the averaged path concentrations by wind speed. This mobile system can be employed to detect leaks. Uncertainties are introduced with the wind measurement accuracy, and the method does not work well without a clear difference in temperature, such as that caused by solar radiation. The method has been used extensively to measure emissions at refineries and oil terminals in Sweden.
Exhibit 9. SIGIS2 Portable Scanning FTIR System
Search the 21M2 Literature Database for open path FTIR.
Environmental Technology Verification Program
References
Beil, A.; R. Daum; G. Matz;and R. Harig. 1998. Remote sensing of atmospheric pollution by passive FTIR spectrometry. EUROPTO '98 (Barcelona): Spectroscopic Atmospheric Environmental Monitoring Techniques. Proceedings of SPIE - The International Society for Optical Engineering, Vol 3493, p 32-43.
Fujita, E. and D. Campbell. 2013. Review of Current Air Monitoring Capabilities near Refineries in the San Francisco Bay Area, Final Report. 111 pp.
Harig, R. and G. Matz. 2001a. Toxic Cloud Imaging by Infrared Spectrometry: A Scanning FTIR System for Identification and Visualization. Field Analytical Chemistry and Technology, Vol 5 No 1-2, p 75-90.
Harig, Roland; Gerhard Matz; and Peter Rusch. 2001b. Scanning infrared remote sensing system for identification, visualization, and quantification of airborne pollutants. Instrumentation for Air Pollution and Global Atmospheric Monitoring. Proceedings of SPIE - The International Society for Optical Engineering, Vol 4574, Paper No 11.
Hashmonay, Ram A., M.G. Yost; C.-F. Wu. 1999. Ambient gaseous leak detection using radial scanning computed tomography and optical remote sensing: Proceedings of the 1998 Environmental Monitoring and Remediation Technologies Conference, 2-5 November 1998, Boston, MA. Proceedings of SPIE - The International Society for Optical Engineering, Vol 3534, p 126-132.
Idwasi, P.O.; G.W. Small; R.J. Combs; R.B. Knapp; R.T. Kroutil. 2001. Ethanol Detection Strategy with Multiple Digital Filtering of Passive FT-IR Interferograms. Report No: ECBC-TR-209, NTIS: ADA396011. 37 pp, Sep 2001.
Kihlman. M., J. Mellqvist, and J. Samuelsson. 2005. Monitoring of VOC Emissions from Refineries and Storage Depots Using the Solar Occultation Flux Method. Chalmers University of Technology, 102 pp.
Minnich, T.R. and R.L. Scotto. 1999. Use of open-path FTIR spectroscopy to address air monitoring needs during site remediations. Remediation, Vol 9 No 3, p 79-92.
Modrak, Mark, Ram A. Hashmonay, Ravi Varma, and Robert Kagann. 2005b. Evaluation of Fugitive Emissions at a Former Landfill Site in Colorado Springs, Colorado Using Ground-Based Optical Remote Sensing Technology, EPA-600/R-05/041. Office of Research and Development, USEPA, 49 pp.
Modrak, Mark, Ram Hashmonay, and Robert Keagan. 2004. Measurement of Fugitive Emissions at a Region I Landfill, EPA-600/R-04-001. Office of Research and Development, USEPA, 51 pp
Modrak, Mark, Ram A. Hashmonay, Ravi Varma, and Robert Kagann. 2005a. Evaluation of a Former Landfill Site in Fort Collins, Colorado Using Ground-Based Optical Remote Sensing Technology, EPA-600/R-05/042. Office of Research and Development, USEPA, 54 pp
Pawloski, J.N.; D.G. Iverson. 1998. Use Optical Remote Sensing Techniques to Monitor Facility Releases. Hydrocarbon Processing, Vol 77 No 9, 4 pp.
Robertson, Thomas and Josh Dunbar. 2005. Guidance for Evaluating Landfill Gas Emissions From Closed or Abandoned Facilities, EPA-600/R-05/123a. Office of Research and Development, USEPA, 217 pp.
Ropertz, A.; T. Lamp; K. Weber; M. Mueller; G. van Haren. 1999. Advanced intercomparison study with different optical sensing technologies – FTIR, UV-DOAS and conventional point sensor measurements of atmospheric gases. Air and Waste 92nd Annual Meeting and Exhibition, 20-24 June 1999, St. Louis, MO. Air and Waste Management Association, Pittsburgh, PA. Paper 99.302.
Sira Ltd. 2004. Recommendations for Best Practise in the Use of Open-Path Instrumentation: A Review of Best Practice Based on the Project Remote Optical Sensing Evaluation (ROSE), August 2001-July 2004. ROSE PD1, 131 pp.
Stoner, Daphne L.; John G. Jolley; Karen S. Miller; Dee Jay Fife; and W.F. Bauer. 1999. Analysis of volatile organic compounds over Octopus Spring, Yellowstone National Park using open-path Fourier transform infra-red spectroscopy. Ninth Annual V.M. Goldschmidt Conference, 22-27 August 1999, Cambridge, Massachusetts.
Tate, J.D., P. Chauvel; K. Taylor. 1997. Monitor ambient air with optical sensing systems. Chemical Engineering (New York), Vol 104 No 6, p 110-114, 30 Jun 1997
Taylor, Richard; James Brunnert. 1999. Fugitive emission monitoring with open-path FTIR at Times Beach, Missouri. Environmental Monitoring and Remediation Technologies, 2-5 November 1998, Boston, MA. Proceedings of SPIE - The International Society for Optical Engineering, Vol 3534, p 2-8, 1999. Missouri Dept. of Natural Resources.
Todd, L.A. and Runa Bhattacharyya. 1997. Tomographic reconstruction of air pollutants: evaluation of measurement geometries. Applied Optics, Vol 36 No 30, p 7678-7688, 20 Oct 1997.
USEPA. 1996. FT-IR Open-Path Monitoring Guidance Document, EPA/600/R-96/040. National Exposure Research Laboratory, Research Triangle Park, NC. 176 pp.
http://www3.epa.gov/ttnamti1/files/ambient/longpath/r-96-040.pdf
USEPA. 1999a. FT-IR Open-Path Monitoring Guidance Document, TR-4423-99-03. National Exposure Research Laboratory, Research Triangle Park, NC. 204 pp.
USEPA. 1999b. Compendium Method TO-16: Long-path open-path Fourier transform infrared monitoring of atmospheric gases. Compendium of Methods for the Determination of Toxic Organic Compounds in Ambient Air, Second Ed. Office of Research and Development, Cincinnati, OH.
http://www.epa.gov/ttnamti1/files/ambient/airtox/to-16r.pdf
USEPA. 2002a. Characterization of Mercury Emissions at a Chlor-Alkali Plant, EPA/600/R-02/007. Office of Research and Development.
http://nepis.epa.gov/Exe/ZyPDF.cgi/P1000UWE.PDF?Dockey=P1000UWE.PDF
USEPA. 2002b. Superfund Five-Year Review Report: Brantley Landfill NPL Site, Island, Kentucky. USEPA Region IV, 136 pp.
http://clu-in.org/characterization/technologies/pdf/f02-04016.pdf
USEPA. 2008. 2nd International Workshop on Remote Sensing of Emissions: New Technologies and Recent Work, 523 pp.
|