Environmental Geophysics
Marine Seismic Methods
Seismic methods, as employed in marine applications, differ little in theory from ground based seismic surveys. A sound wave generating device is used to transmit a sound wave, while receiving devices measure the amplitude and arrival times of the returned (reflected /refracted) signals. However, practical applications of field techniques, field equipment, and geographic control can vary greatly between surface and marine surveys.
In the case of marine surveys, the instrumentation is generally a towed transmitter and array of geophones (figure 1). In some shallow water applications, a specialized array that rests on the ocean floor during acquisition is used (figure 2). Given the difficulty associated with establishing straight survey lines while in a vessel on a body of water, and with the necessity to image deep structures, the field equipment can be cumbersome. Figure 3 demonstrates the scale of field equipment necessary for marine seismic acquisition. Positional control is generally provided by a global positioning system (GPS) where the GPS sensor is mounted on the vessel towing the magnetometer, with a constant offset equal to the distance from the GPS sensor to the geophone array.
A variety of seismic sources are available for marine applications, including water guns (20-1500 Hz), Air Gun (100-1500 Hz), Sparkers (50-4000 Hz), Boomers (300-3000 Hz), and Chirp Systems ( 500 Hz-12 kHz, 2-7 kHz, 4-24 kHz, 3.5 kHz, and 200 kHz). The greatest resolution of near surface structure is generally obtained from the higher frequency sources such as the Chirp systems, while the lower frequency tend to better characterize structure at depth (http://woodshole.er.usgs.gov/operations/sfmapping/seismic.htm ).
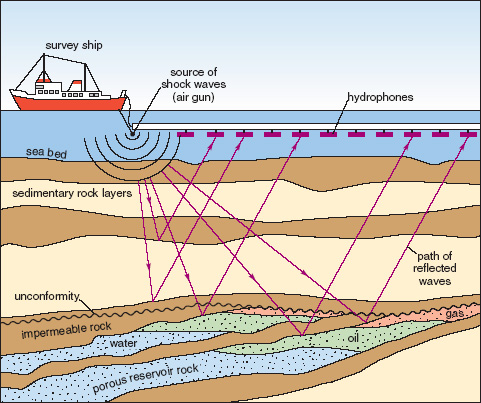
Figure 1. An illustration adapted from an educational website on petroleum illustrates the basic application of seismic data acquisition in a marine setting ( from http://openlearn.open.ac.uk/mod/resource/view.php?id=172129) Use of this image is provided for demonstration purposes, and is not intended as an endorsement for this website.
Figure 2. Illustration showing one technique for ocean floor seismic data acquisition, as employed at a USGS case study in the San Francisco Bay. (http://walrus.wr.usgs.gov/earthquakes/cencal/deepseis.html ).
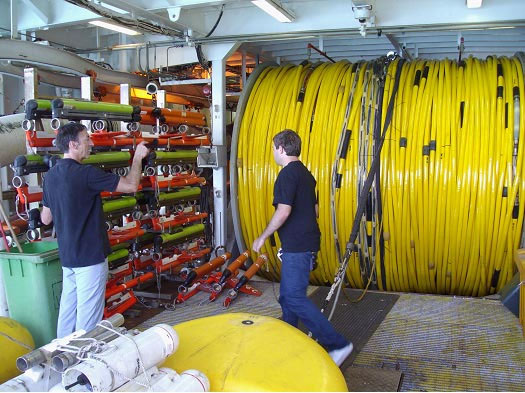
Figure 3.An on-deck example of marine seismic equipment, showing the 8 kilometer solid streamer, tail buoy and stabilizer ‘birds’ inspected prior to the start of an Australian seismic survey. This image is provided for demonstration purposes, and is not intended as an endorsement for use of any of the pictured products.
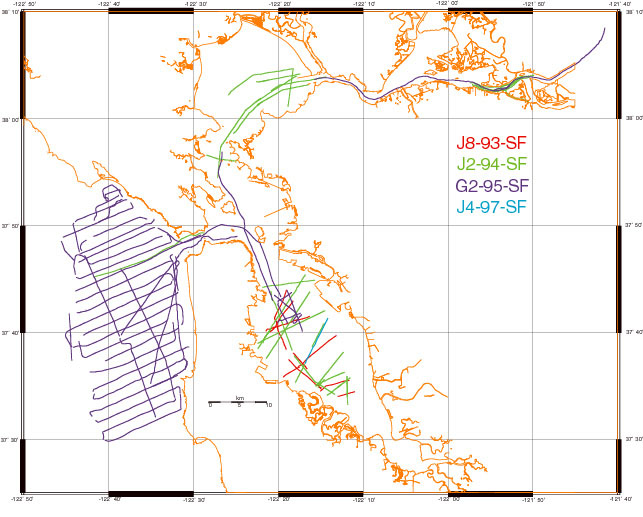
Figure 4. A seismic line coverage map, from a USGS fault mapping investigation in the San Francisco Bay Area, is presented (http://geo-nsdi.er.usgs.gov/metadata/open-file/00-494/metadata.faq.html ).

Figure 5. Example chirp and boomer data acquired from Bear Lake, Idaho. Example illustrates the varying results corresponding to high (chirp) and low (boomer) frequency sources ( http://woodshole.er.usgs.gov/operations/sfmapping/seismic.htm ).