![]() A newsletter about soil, sediment, and groundwater characterization and remediation technologies
A newsletter about soil, sediment, and groundwater characterization and remediation technologies
- Changes in River Sediment Conditions Attributed to Ice Jam-Related Scouring
- International Networking
- New Tools Improve Assessment of Contaminated Ground Water and Surface Water Interaction
- Capping Techniques Affect Contaminant Resuspension
- Increased Federal Funding Expedites Great Lakes Sediment Cleanup
This issue of Technology News and Trends highlights innovative approaches for addressing issues arising at sites with contaminated sediment. An estimated 12-25% of all National Priorities List sites contain contaminated sediment due to inadequate treatment and inappropriate discharge of industrial and municipal wastewaters in the past. Particular problems are posed by heavy metals and hydrophobic organic chemicals that have settled in bottom sediment.
Changes in River Sediment Conditions Attributed to Ice Jam-Related Scouring
SedWeb Resources
The Hazardous Substance Research Centers/South & Southwest (HSRC/S&SW) sponsor SedWebSM (http://www.sediments.org), an online forum for exchanging new information and ideas on contaminated sediments management and research. SedWeb participants are invited to contribute articles to an online library, post items on a bulletin board, subscribe to monthly news advisories, or use more than 150 links to additional online resources.
Alcoa, Inc. began a pilot study in 2001 to evaluate subaqueous capping as a potential remedial alternative for addressing polychlorinated biphenyls (PCBs) in sediment and biota of the lower seven miles of the Grasse River near Massena, NY. The pilot study examined various cap materials and application techniques in a 7-acre study area. [For more information, see the September 2002 issue of Technology News and Trends.] Data collected over the following year demonstrated that the cap had remained intact and relatively unchanged and was functioning as designed.
Spring 2003 monitoring results, however, indicated a loss of cap material and underlying sediment in the study area. Investigations found that these changes were caused by a severe ice jam that formed directly over the cap. The occurence of ice jams severe enough to scour sediment was not known prior to this. As a result, the cap was not designed to withstand forces associated with ice jam-related scour.
A review of recent climatic events revealed that severe winter conditions in 2002-2003 had created a thick ice cover over much of the river. Warmer temperatures the following spring created heavy runoff and higher flows that coupled with a weakening ice cover in the Upper Grasse River to transport a large volume of floating ice pieces downstream. Floating ice encountering the (still intact) ice cover proximate to the study area caused accumulation of a thick ice jam extending approximately four feet above the water surface and through most of the water column.
Modeling indicated that scour of the cap material, underlying sediment, and sediment outside the study area was caused by the turbulence and high velocity of water flow below the ice. The turbulence and high water velocity resulted from an increase in water stage upstream of the ice jam, a reduced cross section below the jam, and the roughness of the ice jam. Sonar imagery and underwater videography supported the finding that scour resulted from hydraulic forces below the toe of the ice jam rather than physical contact between the ice and sediment.
The extent and magnitude of sediment disturbance caused by the ice sour event was characterized by examining changes in sediment elevation and type relative to preice jam conditions (Figure 1). Comparisons indicated that scour ranged in depth from 0.4 to 5.0 feet and occurred in about 15% of the river bottom in the uppermost 1.8 miles of the Lower Grasse River. The greatest scour depth was observed in �pilot cell #4� of the study area, which contained a 24-inch thick sand/topsoil cap covering approximately 1.2 acres.
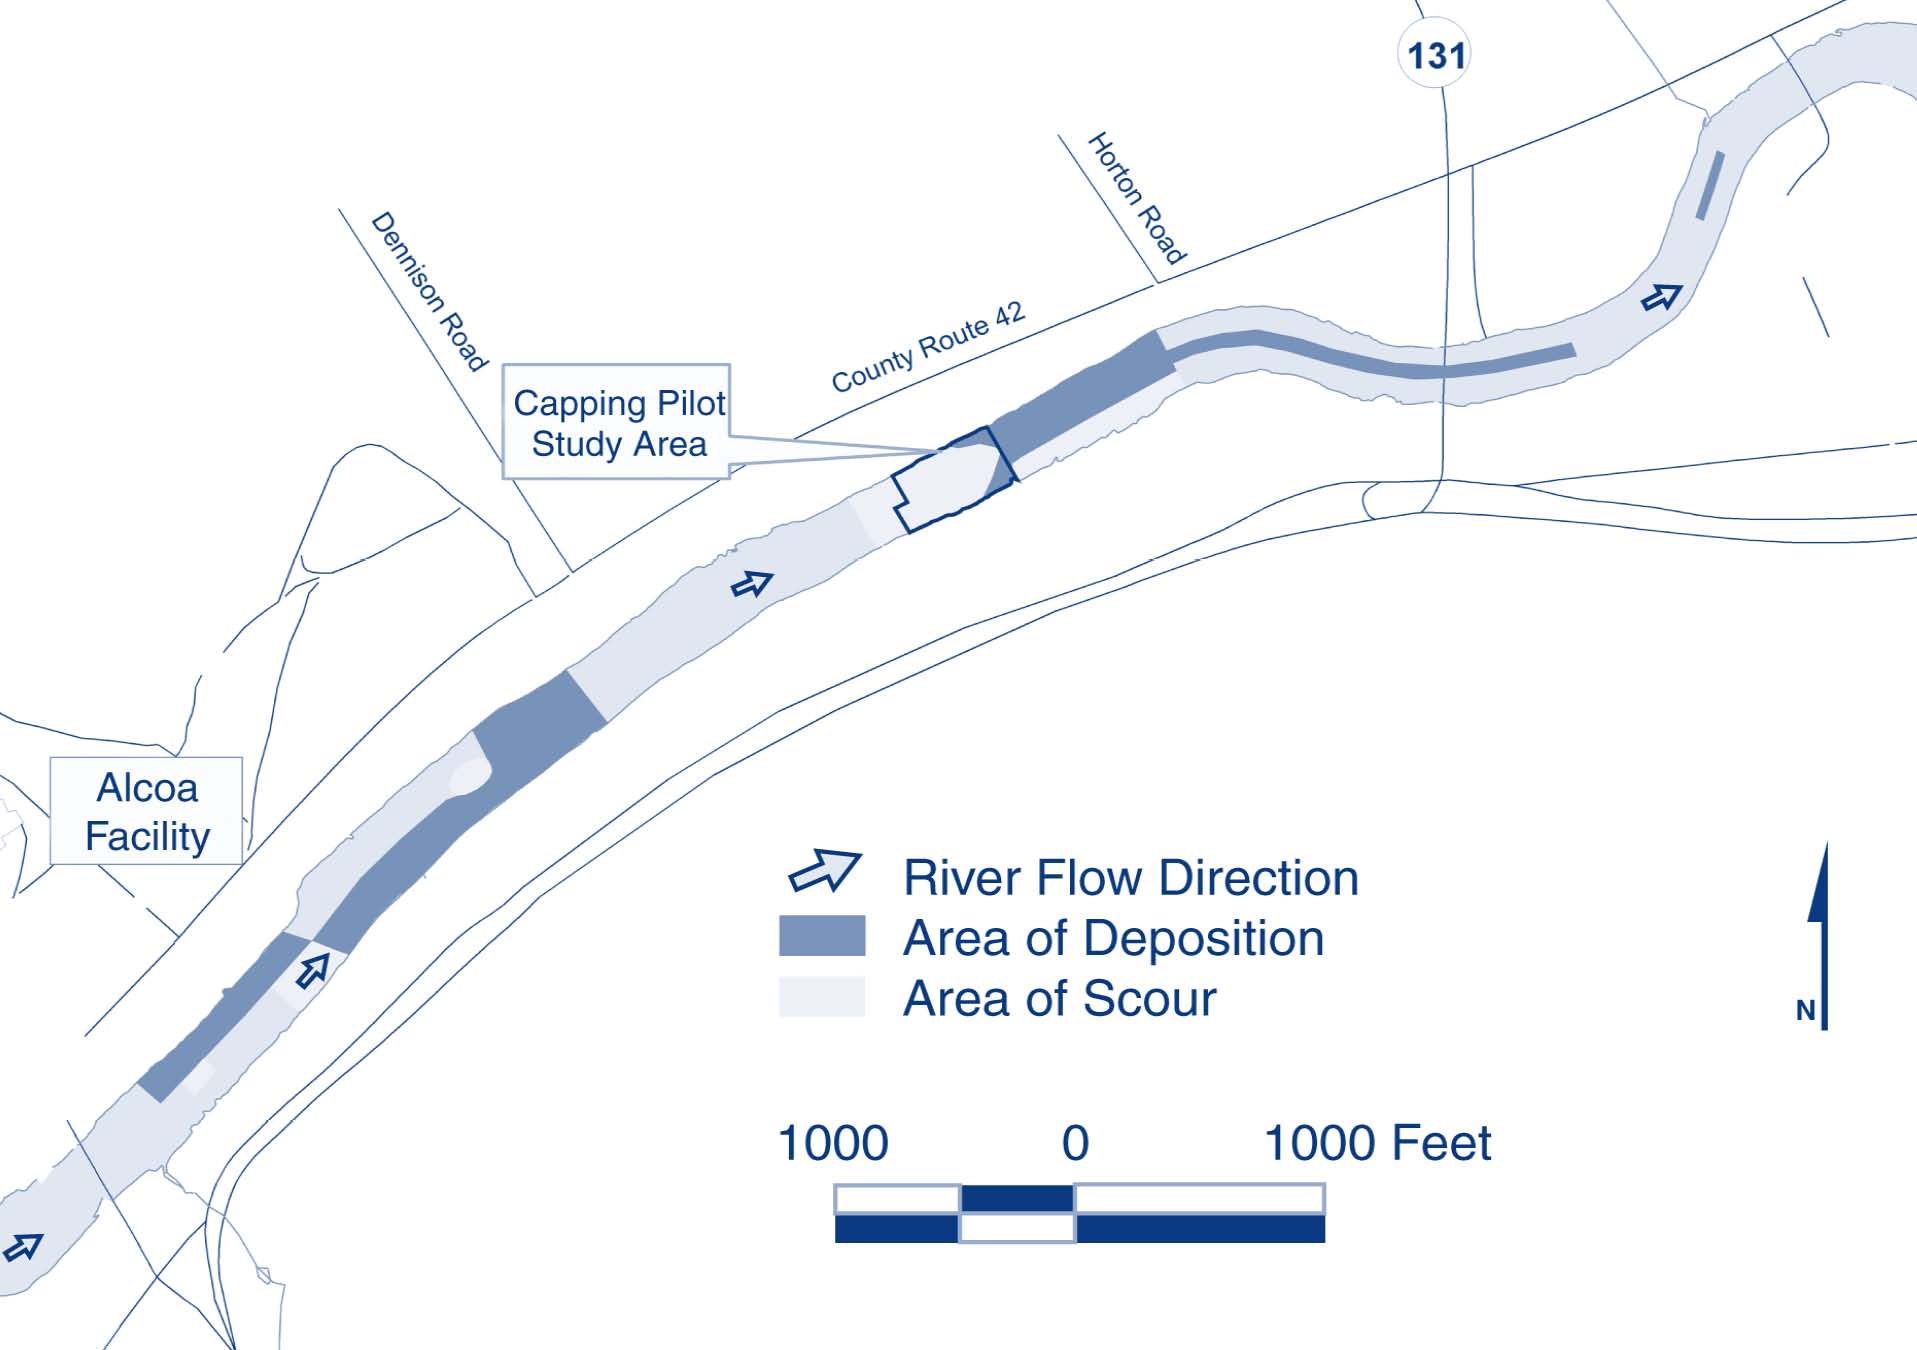
The greatest accumulation of material deposition also occurred in pilot cell #4, where a 4.6-foot increase in sediment elevation was noted. Bathymetric comparisons showed an overall net increase of sediment deposits (in addition to sediments scoured from upstream areas), which indicated that more solids are entering the river system from upstream sources and depositing into the Lower Grasse River than previously believed.
Redistribution of sediments and PCBs during the 2003 ice jam and scour did not significantly affect average PCB concentrations in sediment, water, and fish, suggesting that potential PCB exposure in the river did not change significantly. Surface sediment PCB concentrations in the scour area, however, were higher and more variable than before capping, averaging 13 ppm instead of 8 ppm. This increase is attributed to exposure of deeper sediments typically containing higher PCB concentrations. Surface sediment PCB concentrations decreased in areas subject to deposition, as evidenced by a three-fold reduction immediately downstream of the study area.
Routine monitoring indicated that the scour event did not have an adverse impact on PCB concentrations in the water column or on PCB mass flux. Additionally, system-wide effects from the scour event were not observed during analysis of native fish tissue (with the exception of brown bullhead in one of the monitoring areas). Expanded testing indicated that PCB mobilization to the river banks did not represent an exposure pathway of concern.
A review of historic records and physical evidence such as tree scarring indicated that possibly six ice jam events have occurred in the Lower Grasse River over the past 40 years. Analysis of high-resolution and stratigraphic cores suggested that ice jam-related scouring occurred in the Lower Grasse River four times over the same period or about once each decade. Results of this and other investigative work to date indicate that ice jams, and resulting scour associated with severe ice jams, are limited to the upper 1.8 miles of the Lower Grasse River.
A follow-on study on the Grasse River will be conducted in 2005-2006 to evaluate a range of technical issues, including options for reducing potential risks associated with future ice jamrelated scour events. Options include the installation of an ice control structure to control formation and breakup of jams, and the placement of an armored cap (containing large-grade material) to protect against erosive forces associated with severe jams.
Contributed by Larry McShea, Alcoa, Inc. (724-337-5458 or larry.mcshea@alcoa.com), Young Chang, U.S. EPA Region 2 (212-637-4253 or chang.young@epa.gov), and Jim Quadrini, Quantitative Environmental Analysis, LLC (201-930-9890 or jquadrini@qeallc.com)
The North Atlantic Treaty Organization (NATO) is sponsoring a workshop on sediment assessment and remediation this month in the Slovak Republic to exchange information between North American and European experts. To view the agenda now, or presentations with audio clips later this summer, visit the HSRC/S&SW at http://www.hsrc.org.
New Tools Improve Assessment of Contaminated Ground Water and Surface Water Interaction
The Space and Naval Warfare Systems Command (SPAWAR) and Naval Facilities Engineering Service Center (NFESC) are working with Cornell University to develop techniques for assessing contaminated ground-water discharge into coastal environments. Two of these tools — the Trident® probe and the UltraSeep® meter &mdash help to identify potential areas of ground-water impingement into surface water and to quantify flow rates and contaminant levels. Recent field trials of these tools show they provide rapid assessment of coastal contamination migration and can lead to selection of more effective and less costly remedial alternatives than those selected through conventional characterization techniques.
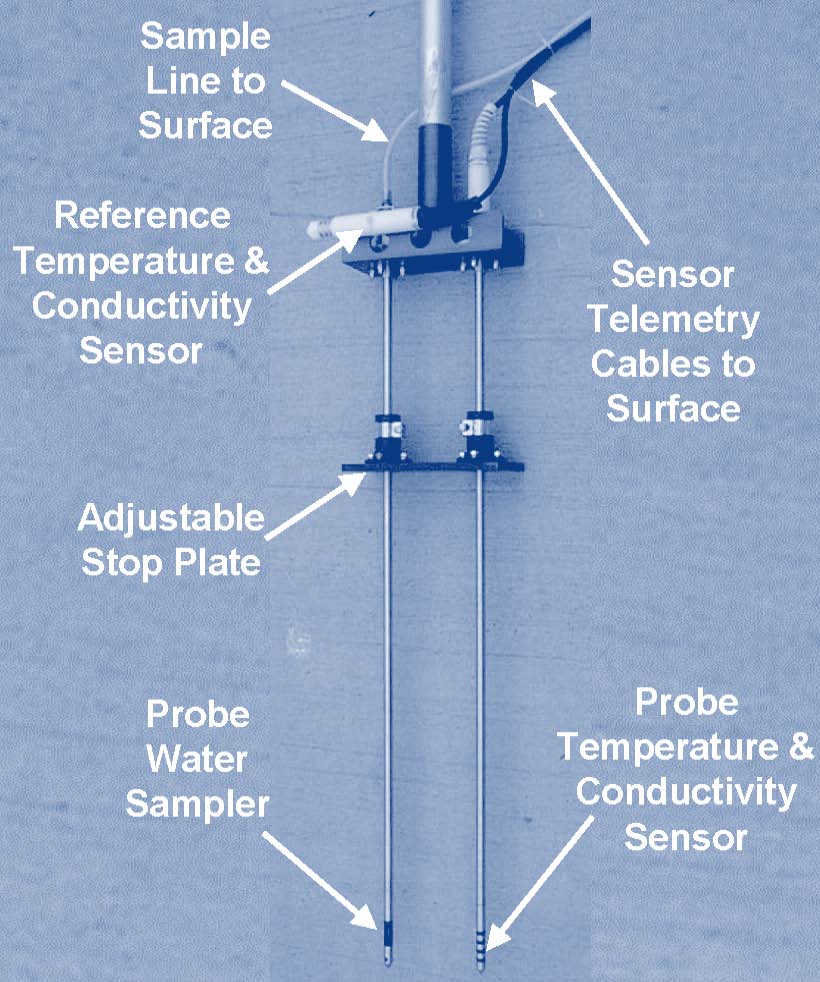
The Trident probe is a flexible, multisensor sampling device consisting of a simple direct-push system equipped with temperature, conductivity, and pore-water sampling probes (Figure 2). Contrasts in temperature and conductivity between surface water and ground water are used to determine likely areas of ground-water impingement. The device�s water sampler allows extraction of interstitial water from sediment at depths reaching 90 centimeters below the sediment/water interface.
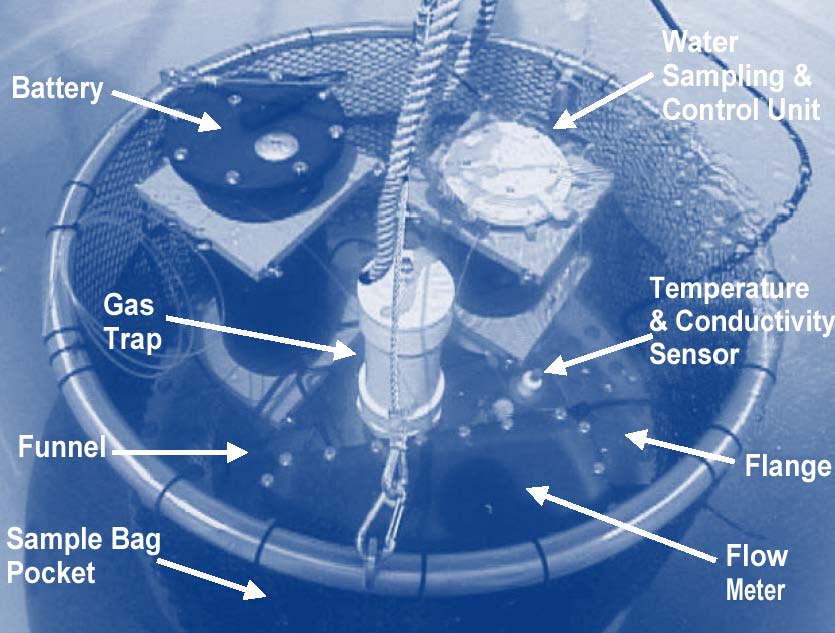
The UltraSeep meter is a modular seepage meter featuring an ultrasonic flow meter that provides continuous and direct measurement of ground water (Figure 3). The device�s water sampler collects up to 10 samples of discharge water, which are collected in proportion to the measured discharge rate using a low-flow peristaltic pump equipped with a sample selector valve and bag array. Temperature and conductivity measurements collected by onboard sensors are stored in an onboard computer that also controls sampling events. The flow meter detects a specific discharge or recharge in the range of approximately 1-1000 cm/day.
The two tools typically are applied as an integrated system, with Trident sensors used first to identify potential contaminant discharge zones. Its water sampler then operates to determine spatial distribution and concentrations of contaminants in the identified discharge zones. Deployment of UltraSeep follows in key areas to quantify the discharge rate and concentrations.
One of the first coastal sites where the integrated system was deployed on a fullscale basis is Naval Air Station (NAS) North Island Site 9, CA. Bordering San Diego Bay, the site was a marshland that was filled during the 1930s with dredge material and subsequently served as a chemical waste disposal site. Shoreline monitoring wells and ground-water modeling suggested that a trichloroethene (TCE) plume was migrating toward but not discharging into the Bay.
The Trident probe was deployed at 20 stations located across an approximate 100- by 200- meter area to a depth of approximately 60 cm, collecting both sensor readings and porewater samples at each station. Though sampling was restricted to 4-hour, low-water time windows, the survey was completed in two days. A localized discharge area of approximately 50 by 100 meters was identified based on a temperature contrast of 1-2 °C that corresponded with elevated concentrations of volatile organic compounds (VOCs) in pore water. UltraSeep deployment then provided direct quantification of the ground-water discharge rates (up to approximately 30 cm/day) and the VOC concentrations. These results were incorporated into a refined conceptual model and resulting remedial strategy for the site that reflects a more isolated zone of discharge into San Diego Bay.
More recently, a full-scale demonstration of the integrated system was completed at NAS Panama City, FL, which lies on St. Andrew Bay along the Florida panhandle. From the mid 1950s to the late 1970s, an area now designated �Area of Concern 1� (AOC 1) was used for firefighter training that generated waste oils, fuels, paint/thinners, and bilge water. The source area was remediated but concern remained for surface water discharge of a residual dichloroethene (DCE) plume that extended to the bay shore.
Use of Trident and UltraSeep technologies demonstrated that DCE concentrations in the discharge zones offshore from AOC 1 were below detection. This finding facilitated a determination that monitored natural attenuation is a feasible remedy for AOC 1, thereby providing a potential cost savings of $1,250,000.
Full-scale deployment of these integrated tools was conducted at several other contaminated sediment sites including the Anacostia River in Washington, DC, and the Naval Construction Battalion Center Davisville Site 7, in Rhode Island. SPAWAR and the NFESC anticipate additional deployments in Naval Station San Diego and NAS Orlando this summer.
Contributed by D. Bart Chadwick, Ph.D., and Stacey Curtis, SPAWAR Systems Center San Diego (619-553-5333 or bart.chadwick@navy.mil and 619-553-5255 or stacey.curtis@navy.mil) and Amy Hawkins, NFESC (805-982-4890 or amy.hawkins@navy.mil)
Capping Techniques Affect Contaminant Resuspension
Recognizing that little information has existed on the potential release of in-situ contaminated sediments during and after capping operations, the U.S. EPA�s National Risk Management Research Laboratory (NRMRL) led an interagency investigation of the issue at two contaminated sediment sites over the past two years. Contaminant releases were measured during cap placement at two confined aquatic disposal (CAD) cells in Boston Harbor, MA, and on creosotecontaminated sediments resulting from past wood-treating opperations at the Wyckoff/Eagle Harbor Superfund site on Bainbridge Island, WA. The study found consistent evidence of contaminant resuspension during capping and identified potential field methods for minimizing resuspension.
The Boston Harbor investigations focused on CAD cells containing 118,500 m³ and 136,850 m³ of dredge material placed in the Mystic River during late 1999. The material is characterized as silty, finegrained sediment containing total petroleum hydrocarbons (TPH), PCBs, and polycyclic aromatic hydrocarbons (PAHs) averaging 1,520 mg/kg, 220 µg/kg, and 64,500 µg/kg, respectively, in concentration.
Nine months after filling the cells, at which point consolidation was considered complete, sand dredged from Cape Cod Canal was placed over the cells to form caps. A tugboat was used to maneuver a partially opened hopper dredge that distributed sand over each cell to achieve a cap thickness of 0.67-1.22 meters. This capping method was expected to minimize disturbance of silt material within the cells.
During cap installation, an aqueous monitoring tool (AMT) was towed behind a boat to collect and integrate in-situ measurements with continuous water collection at the rate of 12 L/min. The AMT sensor package included components for measuring conductivity, temperature and depth; two turbidity sensors; and a Teflon™/ titanium pumping system for water sample collection. The AMT was suspended 1-2 meters above the sediment surface while the research boat maneuvered around the capping vessel. Ten separate sampling events were conducted over a 22-day period. All water samples were analyzed for PCBs, PAHs, TPH, total suspended solids (TSS), and eight RCRA-regulated metals.
Turbidity mapping of the water column revealed that the highest turbidity and TSS concentrations occurred during the first capping run, followed by progressively decreasing turbidity and TSS as capping continued. This suggested that a substantial portion of the sediment suspension measured during the initial runs was due to bed sediment resuspension, and that the amount of bed sediment resuspension decreased with each run.
A similar trend was noted in contaminant concentrations, whereby concentrations of contaminants of concern increased significantly during the first capping run but generally decreased throughout the remainder of capping activities. For example, analytical results indicated that concentrations of total PAHs reached a maximum average of 1,370 ng/L during the first capping run but approached precapping concentrations and averaged 55 ng/L after cap installation. Similarly, PCB concentrations were below detection prior to capping but reached 84 ng/L during the initial run. By the end of the monitoring study, PCB concentrations returned to a non-detectable level.
Similar results were obtained in Eagle Harbor, which is a shallow marine embayment west of Seattle, WA, containing sediment with TPH and PAH concentrations reaching 3,060 mg/kg and 2,120 mg/kg, respectively. The U.S. Army Corps of Engineers (ACE) initiated partial capping in 1993 to begin controlling migration of contaminants from the sediment into the water column and surrounding sediment. The final phase began in 2001, when the ACE capped the area containing the highest contaminant concentrations as part of an enhanced source control effort. Capping was performed by transporting sand to the site in a flat-top barge maneuvered by a tugboat and washing sand overboard with a highpressure hose. Approximately 91,700 m³ of clean sand was distributed to form a cap covering 5.27 hectares.
Contaminant resuspension was studied in a 150- by 275-meter portion of the cap located 76-381 meters from the primary contaminant source. During capping, the AMT was pulled at a depth of one meter above the sediment and immediately behind a barge depositing the cap material on the sediment surface. Three monitoring runs were conducted over three consecutive days of cap installation to obtain a total of 90 water samples.
Elevated turbidity levels were observed at varying distances and directions from the capping barge, and TSS levels were observed 200 meters from the capping area within three hours of capping commencement. Unlike the results at Boston Harbor, turbidity and TSS levels remained high during the following three capping runs, likely due to higher rates of TSS from the cap material itself rather than bed sediment. Turbidity levels were found to decrease to pre-run capping, however, within 1-2 hours.
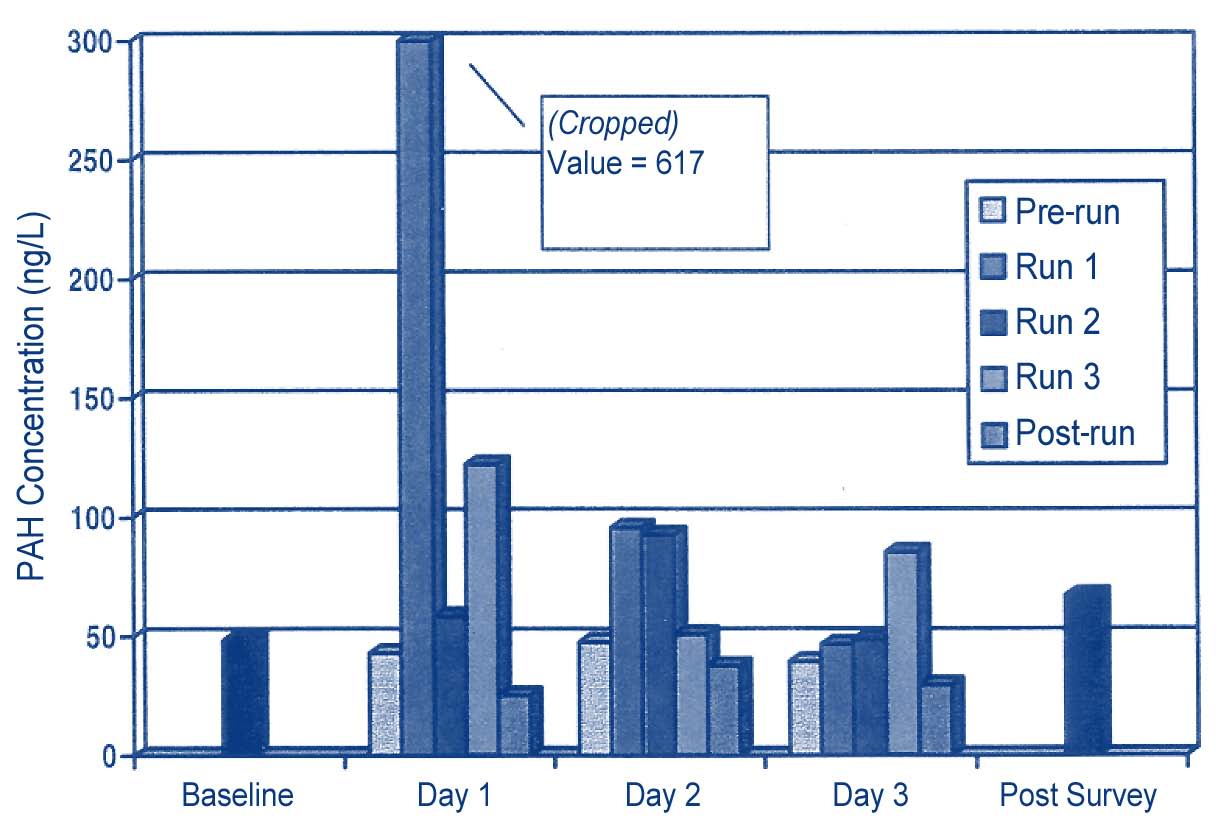
Consistent with the Boston Harbor results, total PAH concentrations in water were elevated during initial capping operations but progressively decreased and dissipated after capping was complete (Figure 4). Rapid dissipation of contaminant plumes likely resulted from the combined effects of sedimentation and off-site plume migration.
These results suggest that alternative techniques for cap installation may considerably reduce negative impacts on water quality. Resuspension may be minimized by placing cap material in several lifts, whereby the first lift uses minimal disturbance techniques to provide a uniform layer of clean material and subsequent lifts are placed more aggressively. While some low-energy techniques may reduce the degree to which native sediments are disturbed, they may slow the cap placement process and prolong the duration of exposures due to resuspension.
This study was conducted in cooperation with the U.S. Army Engineer Research and Development Center, ACE, Batelle Memorial Institute, and EPA Regions 1 and 10. Copies of the complete report will be available from NRMRL later this year at http://www.epa.gov/ORD/NRMRL.
Contributed by Terry Lyons, EPA Office of Research and Development/NRMRL (513-569-7589 or lyons.terry@epa.gov)
Increased Federal Funding Expedites Great Lakes Sediment Cleanup
EPA�s Great Lakes National Program Office (GLNPO) reports that contaminated sediment is the largest major source of contaminants in Great Lakes rivers and harbors entering the food chain. Although the discharge of toxic and persistent chemicals to the Great Lakes has decreased significantly over the past 20 years, continued high concentrations of contaminants in bottom sediment raises concern about potential risks to aquatic organisms, wildlife, and humans.
To address the problem, the Great Lakes Legacy Act of 2002 (GLLA) authorizes $270 million during fiscal years 2004-2008 for remediation of contaminated sediment in 31 areas of concern (AOCs) of the Great Lakes region. Each year, $50 million is targeted for projects that monitor or evaluate contaminated sediment, implement a plan to remediate contaminated sediment, or prevent further or renewed sediment contamination at the AOCs. Priority also is given to projects employing an innovative approach that provides greater environmental benefits than conventional methods or equivalent environmental benefits at a reduced cost.
The Black Lagoon on the Detroit River in Trenton, MI, will be the first contaminated sediment site to be cleaned up under the GLLA. Environmental dredging, which began in October 2004, is in use to remove approximately 90,000 yd³ of sediment contaminated with PCBs, oil and grease, mercury, and other heavy metals from the bottom of the lagoon.
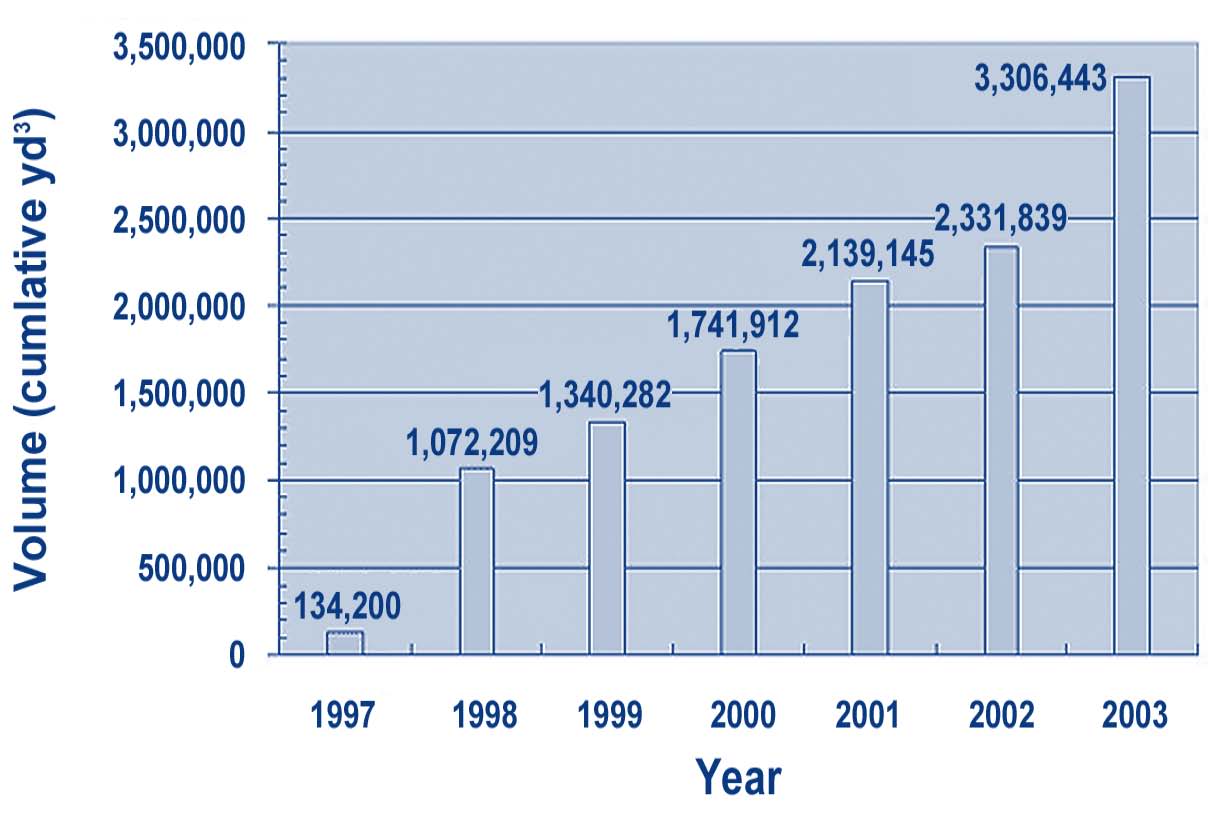
Over 3.3 million yd³ of contaminated sediments were remediated in the U.S. Great Lakes basin between 1997 and 2003 (Figure 5). The GLNPO anticipates that the rate of sediment remediation activities will continue to accelerate with the availability of GLLA funding opportunities. More information on GLNPO�s Contaminated Sediments Program, current projects, and links to related resources is available at http://www.epa.gov/glla.
Contributed by Marc Tuchman, GLNPO (312-353-1369 or tuchman.marc@epa.gov)