 A newsletter that provides descriptions and
performance data for innovative source control technologies that have been
applied in the field.
A newsletter that provides descriptions and
performance data for innovative source control technologies that have been
applied in the field.
|
March 2001
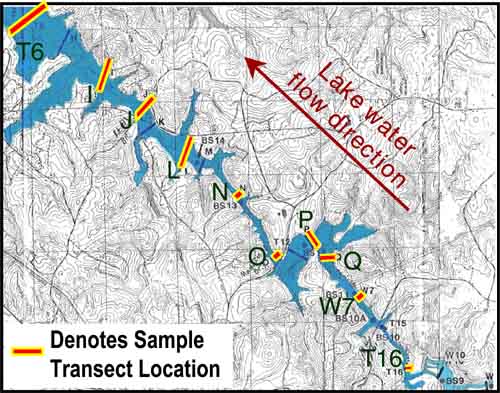
Natural Recovery of PCB-Contaminated Sedimentsby Richard Brenner, U.S. EPA/National Risk Management Research Laboratory, and Victor Magar, Battelle With support from U.S. EPA Region 4, researchers from the U.S. EPA’s National Risk Management Research Laboratory (NRMRL) and Battelle (Columbus, OH) have begun studying the natural recovery of sediments contaminated with polychlorinated biphenyls (PCBs) at the Sangamo-Weston/Twelve Mile Creek/Lake Hartwell Superfund site in South Carolina. PCBs were used in capacitor manufacturing on the Sangamo-Weston property over a 22-year period from 1955 to 1977. It is estimated that a total of 400,000 pounds of these PCBs were discharged into a tributary of Twelve Mile Creek during and following cessation of PCB use at the site. Twelve Mile Creek and Lake Hartwell (located downstream) constitute a fresh water impoundment system characterized by low energy gradients and a dominant depositional environment that is expected to continue for the foreseeable future. The Region’s approach to site cleanup, therefore, was to conduct extensive source control (over $60 million worth) and monitor sediment and biota recovery over time. The goals of this quantitative study are to gather data indicating where the contamination is located, what changes in contaminant migration are occurring, and when contamination concentrations in the sediments may reach acceptable levels. Based on the initial "snapshot" of data collected during 2000, it appears that natural recovery processes, most notably burial by clean sediment, are reducing the near-surface contaminant concentrations. Study results also will help to identify weathering processes, such as PCB dechlorination and volatilization, that may have an impact on natural recovery at this site. Other studies at this site are examining contaminants in fish and other biota, which will provide direct data on recovery of the ecosystem over time. Sediment cores were collected from 10 locations along the approximate centerline of Lake Hartwell and its upgradient Twelve Mile Creek arm and analyzed to determine PCB concentrations.
The four upgradient cores were impacted significantly by deposition of clean sand-sized particles periodically released from an upstream dam. The deposition resulted in substantial burial of contaminated sediment yielding sediment concentrations below 100 µg/kg (parts per billion) to depths of 25 and 65 centimeters in two of the cores, and less than 1 mg/kg (parts per million [ppm]) to depths of 80 and 90 centimeters in the third and fourth cores. Throughout the length of these cores, the highest PCB concentrations were associated with silt/clay layers and the lowest with sand layers.
Downgradient cores, which consisted primarily of silt, were not impacted noticeably by the upstream releases of sand-sized particles. These sediments showed more classical vertical PCB concentration profiles for depositional environments. Maximum PCB concentrations usually occurred during periods of PCB release into the Twelve Mile Creek/Lake Hartwell system, and surface sediment concentrations appear to be asymptotically approaching background levels (Figure 1). Although maximum PCB concentrations in these cores typically occurred at depths of 30-60 centimeters, one core showed maximum contaminant concentrations in the 15- to 25-centimeter depth interval. Near-surface PCB concentrations in four of the six downgradient cores still exceed the site-specific goal of 1 ppm. Sedimentation rates measured from these cores via Pb-210 age dating ranged from 0.75 to 5.43 grams/cm2/year. Sediment accumulation rates ranged from 0.66 to 19 cm/year, but were influenced by sediment water content (i.e., apparent rates were higher near the surface than at depth). At these sedimentation rates, the estimated times for surface sediment (upper 5 centimeters) PCB concentrations to achieve 1.0, 0.4, and 0.05 ppm short- and long-term target concentrations are 1-3, 2-10, and 8-30 years, respectively, depending on sample location.
In addition to recovery by clean sediment deposition, data from this study showed that PCB congener compositions became increasingly dominated by lower chlorinated congeners with sediment depth and corresponding age, resulting in a relative accumulation of ortho-chlorinated congeners and losses of meta- and para-chlorinated congeners. Preliminary evaluation of the data by end member analysis suggests that partial dechlorination in deep deposited sediments and dissolution/volatilization in surface sediments may be active PCB weathering mechanisms at this site. Percent Change in Specific PCB Congener Concentrations with Sediment Depth: Comparison of Segments 1 (0-5 cm Depth) and 8 (35-40 cm Depth) in Downgradient Core
Additional PCB sampling will be conducted in the spring of 2001 to expand the study area, further delineate PCB concentrations in the lake sediments, and help identify external processes such as storm events that are likely to affect the rate or permanence of natural recovery at this site. For additional information, contact Richard Brenner (EPA/NRMRL) at 513- 569-7657 or e-mail brenner.richard@epa.gov. Rapid Sediment Characterization Tools for Ecological Risk Assessmentsby Victoria J. Kirtay, Sabine E. Apitz, Dave Lapota, and James M. Leather, Space and Naval Warfare Systems Center, San Diego The Environmental Sciences Division at the Space and Naval Warfare Systems Center, San Diego (SSC San Diego) has been developing, testing, and implementing different rapid sediment characterization (RSC) tools at several Navy marine sediment sites, including the Naval Air Station in Alameda, CA, the Pearl Harbor Naval Complex, HI, and Hunters Point Shipyard, CA. RSC tools are field transportable and/or laboratory screening tools that measure chemical, biological, or physical parameters on a near real-time basis. When used appropriately, these tools can streamline many aspects of the ecological risk assessment (ERA) process. Navy researchers estimate that, when compared to traditional methods involving extensive sampling and laboratory analysis, the integration of RSC tools and laboratory validation may reduce site characterization costs by as much as 50 percent. The primary goals of a sampling and analysis plan for an ERA are to identify potential contaminant sources and to delineate areas of contamination. Traditional sampling and analysis approaches, however, do not always provide all the information necessary to support the ERA process in a cost-effective and timely manner. Risk assessments performed in marine environments often are hindered further by the complexity and heterogeneity of marine ecosystems. As a result, additional measures to facilitate the assessment process are needed. One measure that can be implemented at various stages of the ERA is the use of RSC technologies. These tools can be used to delineate areas of concern, fill information gaps, and assure that expensive, certified analyses have the greatest possible impact. A wide variety of RSC tools are capable of making these types of measurements. These tools can be deployed on site or used in the laboratory to provide rapid, semi-quantitative results. Primary RSC tools and their typically targeted contaminants or parameters include:
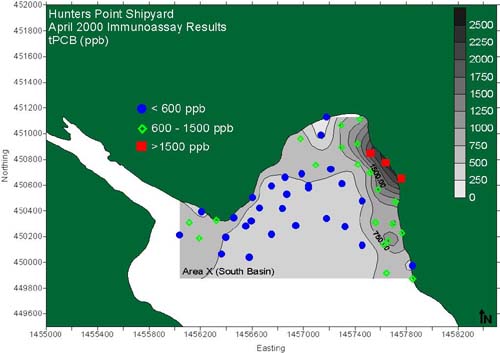
These tools can be used independently or in conjunction with one another, depending upon data requirements and objectives of the risk assessment. For example, two RSC tools were used for a sediment screening study at Hunters Point Shipyard to support a baseline ERA sampling design. Surface sediment samples were collected in a grid pattern from 94 locations in the five offshore areas of concern. Samples were screened for PCBs using immunoassays and for heavy metals using X-ray fluorescence spectrometry at the SSC San Diego laboratory. The results were used to refine the sampling design for a more detailed study of sediment chemistry, toxicity, and bioaccumulation. In particular, screening results were used to ensure that the baseline assessment study sampling stations span the entire range of contaminant concentrations and, therefore, represent the full range of potential exposure. Ten percent of the screening samples were submitted to a standard analytical laboratory in order to obtain a quantitative analysis of all contaminants of concern, to verify screening results, and to provide additional surface sediment data supporting the assessment study. In order to fully evaluate the extent of contaminant distribution at the Hunters Point site, SSC researchers examined the screening results for PCBs, copper, lead, zinc, and chromium. For example, the PCB results from one of the areas of concern indicate two potential source areas for elevated PCBs in the offshore sediments—one on the northeast side and another on the west side of the embayment (Figure 2).
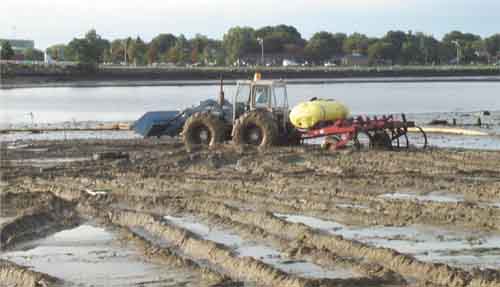
Screening results obtained through RSC tools also can be used to delineate strata boundaries ensuring that each potential source is sampled and that laboratory data will be available to estimate relative source contributions to sediments. As is often the case in sediment assessments, multiple potential sources are present. These sources have to be considered in designing a sampling plan for the baseline assessment because they may require some method of source allocation. RSC screening results also may aid in pollution prevention by identifying potential source areas in need of control before extensive remedial options are considered in offshore sediment areas. RSC tools can streamline ERA site investigations, but RSC methods and tools are not necessarily subject to the same quality assurance/quality control protocols as are standard laboratory methods. The method(s) by which users interpret and manage RSC data, therefore, must be addressed by regulators and stakeholders early in the characterization process. Generally, regulators and the user community have accepted RSC results as part of the analytical results for ERA decision making but not as stand-alone data. For these reasons, RSC tool results should be balanced with and supplemented by standard, certified laboratory analyses. The Environmental Sciences Division at SSC San Diego continues its efforts to develop and test different methods and tools for characterizing the nature and extent of contamination in marine sediments. For more information, contact Victoria J. Kirtay (Environmental Sciences Division D36) at 619-553-1395 or e-mail kirtay@spawar.navy.mil. Bioremediation of Coal Tar Contaminated Marine Sedimentsby Jay Babin, Golder Associates Ltd., Brian Senefelder, Golder Associates Inc., and Tom Murphy, Ph.D., National Water Research Institute of Environment Canada Environment Canada has developed a new, patented technology involving the injection of remedial amendments into sediments to enhance contaminant degradation by indigenous microorganisms. Application of this technology, known as Limnofix In-Situ Sediment Treatment (LIST), began in 1998 as part of a five-year program evaluating the effectiveness of remedial amendments to intertidal zone marine sediments at a former manufactured gas plant in Salem, MA. Analyses of sediment samples collected from one of the site’s treatment areas reflected an average reduction of 90 percent for total concentration of polycyclic aromatic hydrocarbons (PAHs). Aggressive remediation at this site, which currently is owned by KeySpan Energy Delivery (formerly Boston Gas Company) and National Grid, U.S.A. (formerly New England Electric System), began in 1994 when the Massachusetts Electric Company installed a subsurface barrier wall to abate migration of separate-phase coal tar from the terrestrial portion of the site to an adjacent cove. Golder Associates Ltd. (as licensing agent) then began conducting in situ bioremediation of contaminated sediments in the adjacent intertidal zone. With 9-foot tidal changes, this zone comprises a thin layer of sand and silt underlain by a dense silt. Underlying these sediments is a layer of silt with course- to medium-sand lenses. It is estimated that the contaminated sediment covers 60,000 square feet. With an average depth of 8 inches to the underlying silt layer, the total volume of impacted sediment is estimated at 1,500 cubic yards. Pre-treatment sampling and analysis showed concentrations up to 339 mg/kg total PAHs and 225 mg/kg total volatile organic compounds (VOCs). Laboratory bench-scale tests indicated favorable conditions for full-scale amended bioremediation. There was an abundance of marine heterotrophs and VOC- and PAH-degrading indigenous microorganisms and sediment nutrients present; however, oxygen supplies were limited. Three treatment applications, using calcium nitrate as a terminal electron acceptor to produce an oxic environment, were performed during the summer in 1998 and 1999. A modified chisel plow (pulled by an agricultural tractor) was used to inject the calcium nitrate solution directly into the sediments (Figure 3). Following injection of the oxidant, a flattener board was pulled over the sediments to close the furrows and seal the calcium nitrate solution in the sediments, thus reducing tidal washout.
Treatment was performed during morning low tides. In a portion of the intertidal zone where sediment consistency was insufficient to support heavy field equipment, the calcium nitrate solution was injected using a portable pumping system and small-diameter injection rods that were manually pushed into the sediments. Throughout the process, an oil containment boom system was employed to capture small oil sheens that resulted from treatment. Pre- and post-treatment data acquired during 1998-1999 showed that the concentration of total PAHs (primarily naphthalene, 1-methylnaphthalene, 2-methylnaphthalene, and phenanthrene) were reduced from an average of 115 mg/kg to 10 mg/kg. Significant concentration reductions also were shown for other contaminant types: 85 percent for diesel-range organics (an average of 400 mg/kg reduced to 50 mg/kg), 77 percent for gasoline-range organics (168 mg/kg reduced to 38 mg/kg), and 50 percent for total petroleum hydrocarbons (400 mg/kg reduced to 200 mg/kg). Indirect indicators that biodegradation occurred at increased levels within the treatment area included the observation of green alga and gaseous emissions from the sediment that were previously absent, field measurement of oxidizing conditions that contrasted to reducing conditions outside the treatment area, and decreased organic constituent concentrations. No LIST applications were made in 2000 so that additional sampling and laboratory testing can be conducted in 2001 to better understand the actual mechanisms for biodegradation and observed contaminant reductions at this site. Several years may be required, however, to determine whether the separate-phase coal tar encountered in these sediments can be abated and to what levels the coal tar constituents can be degraded when compared to background conditions. For more information, contact Brian Senefelder (Golder Associates Inc.) at 716-215-0650 or e-mail bsenefelder@golder.com, or Dr. Tom Murphy (National Water Research Institute of Environment Canada) at 905-336-4602 or e-mail tom.murphy@cciw.ca. Additional technical assistance for this project is provided by Joe Callanan (Massachusetts Electric Company) and Sandy Taft (KeySpan Energy Delivery).
|
|||||||||||||||||||||||||||||||||||
|
|||||||||||||||||||||||||||||||||||