Sediments
conceptual site models
Valence state: The combining capacity of an atom or radical determined by the number of electrons that it will lose, add, or share when it reacts with other atoms.
Source: The American Heritage™ Dictionary of the English Language, Fourth Edition
Copyright © 2000 by Houghton Mifflin Company.
free product: A NAPL found in the subsurface in sufficient quantity that it can be partially recovered by pumping or gravity drain.
aerobic: Direct aerobic metabolism involves microbial reactions that require oxygen to go forward. The bacteria uses a carbon substrate as the electron donor and oxygen as the electron acceptor. Degradation of contaminants that are susceptible to aerobic degradation but not anaerobic often ceases in the vicinity of the source zone because of oxygen depletion. This can sometimes be reversed by adding oxygen in the form of air (air sparging, bioventing), ozone, or slow oxygen release compound (e.g., ORC(r)).
Aerobic dechlorination may also occur via cometabolism where the dechlorination is incidental to the metabolic activities of the organisms. In this case, contaminants are degraded by microbial enzymes that are metabolizing other organic substrates. Cometabolic dechlorination does not appear to produce energy for the organism. At pilot- or full-scale treatment, cometabolic and direct dechlorination may be indistinguishable, and both processes may contribute to contaminant removal. For aerobic cometabolism to occur there must be sufficient oxygen and a suitable substrate which allows the microbe to produce the appropriate enzyme. These conditions may be present naturally but often in the presence of a source area oxygen and a substrate such as methane or propane will need to be introduced.
Adapted from US. EPA 2006 Engineering Issue: In Situ and Ex Situ Biodegradation Technologies for Remediation of Contaminated Sites
anaerobic: Direct anaerobic metabolism involves microbial reactions occurring in the absence of oxygen and encompasses many processes, including fermentation, methanogenesis, reductive dechlorination, sulfate-reducing activities, and denitrification. Depending on the contaminant of concern, a subset of these activities may be cultivated. In anaerobic metabolism, nitrate, sulfate, carbon dioxide, oxidized metals, or organic compounds may replace oxygen as the electron acceptor.
Anaerobic dechlorination also may occur via cometabolism where the dechlorination is incidental to the metabolic activities of the organisms. In this case, contaminants are degraded by microbial enzymes that are metabolizing other organic substrates. Cometabolic dechlorination does not appear to produce energy for the organism. At pilot- or full-scale treatment, cometabolic and direct dechlorination may be indistinguishable, and both processes may contribute to contaminant removal.
Quoted from US. EPA 2006 Engineering Issue: In Situ and Ex Situ Biodegradation Technologies for Remediation of Contaminated Sites
architecture: "Architecture" refers to the physical distribution of the contaminant in the subsurface. Residuals that take the form of long thin ganglia or small dispersed globules provide a larger surface area that will dissolve much faster than if the same amount of liquid were concentrated in a competent pool.
Sources: For purposes of this discussion, a DNAPL source zone includes the zone that encompasses the entire subsurface volume in which DNAPL is present either at residual saturation or as "pools" of accumulation above confining units. In addition, the DNAPL source zone includes regions that have come into contact with DNAPL that may be storing contaminant mass as a result of diffusion of DNAPL into the soil or rock matrix.
source zone: For purposes of this discussion, a DNAPL source zone includes the zone that encompasses the entire subsurface volume in which DNAPL is present either at residual saturation or as "pools" of accumulation above confining units. In addition, the DNAPL source zone includes regions that have come into contact with DNAPL that may be storing contaminant mass as a result of diffusion of DNAPL into the soil or rock matrix.
focal ulceration: The process or fact of a localized area being eroded away.
metaplasia of the glandular stomach: A change of cells to a form that does not normally occur in the tissue in which it is found.
hyperplasia of the glandular stomach: A condition in which there is an increase in the number of normal cells in a tissue or organ.
histiocytic: Degenerative.
duodenum: First part of the small intestine.
microcytic: Any abnormally small cell.
squamous cell papillomas: A small solid benign tumor with a clear-cut border that projects above the surrounding tissue.
squamous cell carcinomas: Cancer that begins in squamous cells-thin, flat cells that look under the microscope like fish scales. Squamous cells are found in the tissue that forms the surface of the skin, the lining of hollow organs of the body, and the passages of the respiratory and digestive tracts. Squamous cell carcinomas may arise in any of these tissues.
jejunum: The middle portion of the small intestine, between duodenum and ileum. It represents about 2/5 of the remaining portion of the small intestine below duodenum.
ileum: The distal and narrowest portion of the small intestine.
squamous: Flat cells that look like fish scales.
metaplasia: A condition in which there is a change of one adult cell type to another similar adult cell type.
ossification: The process of creating bone, that is of transforming cartilage (or fibrous tissue) into bone.
clastogenesis: Any process resulting in the breakage of chromosomes.
neoplastic: Abnormal and uncontrolled growth of cells.
ulceration: The process or fact of being eroded away.
leucocytosis: An elevation of the total number of white cells in blood.
neutrophils: A type of white blood cell.
chromodulin: A small protein that binds four trivalent chromium ions.
biomagnification: The increased accumulation and concentration of a contaminant at higher levels of the food chain; organisms higher on the food chain will have larger amounts of contaminants than those lower on the food chain, because the contaminants are not eliminated or broken down into other chemicals within the organisms.
exencephaly: Cerebral tissue herniation through a congenital or acquired defect in the skull.
everted viscera: Rotated body organs in the chest cavity.
To Be Considered: Documents, such as federal or state guidances, that are not legally binding but may be relevant to the topic in question.
gaining: A gaining surface water body is one where groundwater flows into it.
losing: A surface water body is losing when there is a permeable sediment bed that is not in contact with the groundwater allowing the surface water to seep through it.
fluvial: Of or pertaining to flow in rivers and streams.
lacustrine: Of or pertaining to a lake as in lacustrine sediments—sediments at the bottom of a lake.
lipid: Any class of fats that are insoluble in water.
lipophilic: Able to dissolve in lipids—in this case fatty tissue.
organelles: A part of a cell such as mitochondrion, vacuole, or chloroplast that plays a specific role in how the cell functions and membranes.
RfD: The RfD is an estimate of a daily exposure of the human population (including sensitive sub-groups) to a substance that is likely to be without "the appreciable risk of deleterious effects during a lifetime." An RfD is expressed in units of mg/kg-day.
autonomic: That part of the nervous system that controls non-conscious actions such as heart rate, perspiration and digestion.
ataxia: Lack of muscle coordination.
funnel-and-gate configuration: A system where low-permeability walls (the funnel) placed in the saturated zone direct contaminated ground-water toward a permeable treatment zone (the gate)
References: ATSDR (Agency for Toxic Substances and Disease Registry). 2015. Draft Toxicological Profile for Perfluoroalkyls. 574 pp.
EFSA (European Food Safety Authority). 2008. Opinion of the scientific panel on contaminants in the food chain on perfluorooctane sulfonate (PFOS) and perfluorooctanoic acid (PFOA) and their salts. EFSA Journal 653:1-131.
Hekster, F.M., R.W.P.M. Laane, and P. de Voogt. 2003. Environmental and toxicity effects of perfluoroalkylated substances. Reviews of Environmental Contamination and Toxicology 179:99-121.
Higgins, C. and R. Luthy. 2006. Sorption of perfluorinated surfactants on sediments. Environmental Science & Technology 40(23):7251-7256.
HSDB (Hazardous Substances Data Bank). 2012 Update. Perfluorooctanoic acid.
Kaiser, M.A., B.S. Larsen, C-P.C. Kao, and R.C. Buck. 2005. Vapor pressures of perfluorooctanoic, -nonanoic, -decanoic, -undecanoic, and -dodecanoic acids. Journal of Chemical and Engineering Data 50(6):1841-1843.
Kauck, E.A. and A.R. Diesslin. 1951. Some properties of perfluorocarboxylic acids. Industrial and Engineering Chemical Research 43(10):2332-2334.
Lewis, R.J., Sr., ed. 2004. Sax's Dangerous Properties of Industrial Materials. 11th ed. Wiley-Interscience, Hoboken, NJ. V3:2860.
Lide, D.R. 2007. CRC Handbook of Chemistry and Physics. 88th ed. CRC Press, Boca Raton, FL. 3-412.
SRC (Syracuse Research Corporation). 2016. PHYSPROP Database. SRC Scientific Databases,
Accessed May 2016.
UNEP (United Nations Environmental Program). 2015. Proposal to List Pentadecafluorooctanoic Acid (CAS No: 335-67-1, PFOA, Perfluorooctanoic Acid), Its Salts and PFOA-Related Compounds in Annexes A, B and/or C to the Stockholm Convention on Persistent Organic Pollutants. UNEP/POPS/POPRC.11/5.
USEPA (U.S. Environmental Protection Agency). 2016. Drinking Water Health Advisory for Perfluorooctanoic Acid (PFOA).#pdfsmall# Office of Water, EPA 822-R-16-005, 103 pp
Conceptual site models (CSM) are part of the data quality objectives process, which is required for all site activities that involve gathering environmental data (EPA 2006). Since the fate and transport of contaminants in sediments is often complex and depends on the physical/chemical properties of the contaminant and sediments, the type of water body in which the sediments are deposited, and whether the water body is gaining or losing, it is important that the CSM be both detailed and complete.
Generally two types of CSMs are developed during the course of a site investigation and remediation. The first characterizes the hydrogeologic construct of the area of concern and depicts contaminant fate and transport (the source location of the contaminants, where are they currently found, any biological or geochemical transforms, and where will they eventually end up). This information is used to produce a CSM that addresses the potential risks that the contaminants have to human health and ecosystems.
It is important that the CSM account for the biological and geochemical activities occurring in the sediment's transition zone. Transition zones are usually found in gaining water bodies and contain areas dominated by just groundwater, a mixture of groundwater and surface water, and just surface water (EPA 2008). The transition zone is an ecologically active area beneath the sediment/water interface where a variety of important ecological and physicochemical conditions and processes may occur (EPA 2008). These processes must be taken in to account when determining risk and cleanup levels.
The CSM must also account for the complexity and uncertainty of data in the transition zone. For example, Conant et al. (2004) found that a tetrachloroethene (PCE) ground water plume changed its size, shape, and composition as it passed through the transition zone. Biodegradation in the top 2.5 meters of the transition zone reduced the PCE concentrations but created high concentrations of seven different transformation products, thereby changing the toxicity of the plume. The biodegradation was spatially variable and concentrations in the streambed varied by a factor of 1 to 5000 over distances of less than 4 meters horizontally and 2 meters vertically (EPA 2008).
The figures below illustrate the importance of considering whether the contamination is the result of current activities, historic activities or both; how groundwater flow into a seemingly uniform sediment bed is complicated by underlying aquifer geology; and finally the usefulness of a remedial design CSM for identifying potential flaws.
Figure 1 shows a variety of potential sources for contaminated sediment. Sediments can become contaminated by processes such as:
- overland flow from an upland source,
- discharge of contaminated groundwater
- direct discharge of non-aqueous phase liquids
- air deposition of contaminants (e.g., mercury from fossil fuel power plants),
- transport of contaminated sediments from an upstream source.
A general rule of thumb is that sediments should not be remediated until all sources have been identified and eliminated so that they can no longer contaminate the sediments. As shown in the figure, sources can be current (e.g., active advection of contaminated groundwater into sediment) or historic (e.g.,1970s release of PCBs from manufacturing and storage facilities with no new upland or upstream releases occurring). Identification of active sources can also be complicated, as is illustrated by the Portland Harbor shoreline.
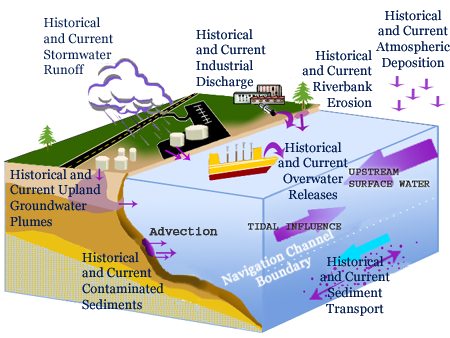
Figure 1. Generalized sediments CSM showing complexity of potential contaminant sources.
In developing the CSM, assumptions should be verified. For example, in the cleanup of PCB contaminated sediment in the Ashtabula River, one of the underlying initial assumptions was that the release of PCBs was historic; however, when baseline sampling was performed prior to starting the dredging operation, it was discovered that there was an active source on one of the river's tributaries (Cieniawski 2008). Had this source not been discovered and eliminated, the expensive remedy would have eventually failed.
Figure 2 demonstrates how understanding groundwater to surface water interaction is key to the success of a remedy. This is a stylized depiction of groundwater flow into a river system with preferential pathways for groundwater to surface water discharge. If an assumption is made that the discharge of contaminated water is diffuse and uniform across the sediment bed, it may lead to an incorrect estimate of risk or potentially improper design of a cap. To ensure an accurate CSM, preferential flow paths should be identified. (See EPA 2008 for a more detailed discussion of groundwater/surface water interactions and their relationship to contaminant transport and the Fate and Transport section for a more detailed description of contaminant movement in sediment systems. View thermal images of preferential flows into surface water bodies. Also note that the area of concern may have losing as well as gaining sections. Even without an upland source of contaminated groundwater, capping the contaminated sediment could still allow surface water to flow through it, thus contaminating the underlying groundwater.
Figure 2. Groundwater discharge to a river through a heterogeneous subsurface.
Figure 3 is a stylized CSM of a proposed site remedy. Note that movement of the sediment contaminant sources through the subsurface (i.e., NAPL and the contaminant groundwater plume) has been stopped by a shoreline barrier wall. The cap uses organoclay to adsorb the NAPL and contaminants in the groundwater that have already entered the aquifer under the river and will discharge through the sediment bed into the cap. The barrier wall must be sufficiently deep to prevent contaminants from flowing under it or they will eventually break through the cap material. When using a barrier wall for upland containment, its weaknesses should be carefully considered. For example, sheet pile walls are prone to leakage at the seams; and slurry walls are subject to non-uniform placement and contaminant diffusion through the slurry.
Figure 3. Stylized CSM of a contaminated sediment site remedy with an active source.
 ECO Update / Groundwater Forum Issue Paper: Evaluating Ground-Water/Surface-Water Transition Zones in Ecological Risk Assessments
EPA, EPA-540-R-06-072, 30 pp 2008
Ground-Water Plume Behavior Near the Ground-Water/Surface Water Interface of a River
Conant, Jr., Brewster
EPA, Proceedings of the Ground-Water/Surface-Water Interactions Workshop, EPA/542/R-00/007, 2000
Guidance on Systematic Planning Using the Data Quality Objectives Process
EPA, Office of Environmental Information, EPA QA/G-4, EPA/240/B-06/001, 121 pp, February 2006
Proceedings of the Ground-Water/Surface-Water Interactions Workshop
EPA, EPA 542-R-00-007, 204 pp, 2000
The U.S. EPA's Great Lakes Legacy Act Ashtabula River Clean-Up
Cieniawski, Scott
USEPA, Great Lakes Program Office, 46 pp (PPT), 2008
Environmental Research Brief— The Impact of Ground-Water/Surface-Water Interactions on Contaminant Transport with Application to an Arsenic Contaminated Site
Ford, Robert
EPA, Office of Research and Development, 22 pp, 2005
Guidelines for Ecological Risk Assessment
USEPA, Office of Research and Development, EPA 630/R-95/002F, 1998
Top of Page