
- Featured Articles
- Characterization and Testing: Mapping of Sediment Particle Size with In Situ Friction-Sound Probe
- New Remediation Technology: Bioreactive Mat for Treatment of Chlorinated Volatile Organic Compounds in Wetlands at Aberdeen Proving Ground, Maryland
- Long-Term Performance: Multi-Component Containment System for Contaminated Sediment in North Portland
- Resources
- CLU-IN Website: Sediments
- New Webinar Series: Porewater Concentrations and Bioavailability
- EPA Directive: Use of Amendments for In Situ Remediation at Superfund Sediment Sites
- New ITRC Guidance: Contaminated Sediments Remediation; Remedy Selection for Contaminated Sediments
- ICES Technical Report Series on Chemical and Biological Measurements: Determination of Polychlorinated Biphenyls (PCBs) in Sediment and Biota
 Download This Issue in Adobe PDF® Format
(1.27MB/12pp/PDF)
This issue of Technology News & Trends highlights characterization and remediation strategies for contaminated sediment, which impairs the uses of many water bodies and is often a contributing factor to the thousands of fish consumption advisories that have been issued nationwide. As of December 2012, remedies for 70 large sediment sites were selected under the Superfund program and Superfund evaluation was underway for another 50 sites (OSWER Directive 9200.2-128FS). Difficulties in contaminated sediment cleanup are often associated with the variability of contaminant occurrence or transport due to changing surface and near-surface water conditions, the adequacy of characterization tools or techniques, or limitations of remediation technologies employed in subaqueous settings. Site-specific projects described in this issue demonstrate development, testing or full-scale use of innovative technologies and approaches for addressing these issues.


Characterization and Testing: Mapping of Sediment Particle Size with In Situ Friction Sound Probe
Contributed by Bart Chadwick and Ernie Arias, U.S. Navy SPAWAR Systems Center
The U.S. Navy's Space and Naval Warfare Systems Command, together with federal and private partners, recently field-tested a sediment friction sound probe (SED-FSP) prototype designed to improve in situ classification of surface sediment type over a broad range of applications and conditions. The SED-FSP technology, developed in 2012 for the Navy by Zebra-Tech, Ltd., measures friction sound intensity to derive particle grain size. Full-scale demonstrations were conducted at three sites: 1) the mouth of Chollas Creek in San Diego Bay at Naval Base San Diego, a contaminated sediment site; 2) in San Diego Bay at North Island Naval Air Station Installation Restoration (IR) Site 9, a groundwater-surface water interaction site; 3) and the Anacostia River in Washington, DC, a contaminated sediment capping site. The probe exceeded performance criteria — reliability, efficiency, and specificity — by 5 to 17 percent. Overall demonstration results suggest that the SED-FSP can offer a more cost-effective and efficient method of analyzing in situ grain size when compared to traditional techniques, such as sieving and sedimentation, laser diffraction, electro-zone sensing, and microscopy.
Grain size can provide valuable information for identifying contaminated sediment and contaminant discharge zones at sediment study sites. Traditional techniques for determining sediment grain size, which include laboratory analyses of core or grab samples, are time- and labor-intensive, and the turnaround time between sample collection and analysis can delay site characterization. Friction sound technology, such as the SED-FSP, offers a simple, quick and robust technique for measuring sediment (and soil) grain size by measuring friction sound intensity at the particle/sensor interface, which is correlated with particle radius.
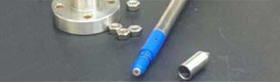
Figure 1. Acoustic probe tip and microphone embedded in the Delrin® isolator.
The SED-FSP uses an acoustic microphone placed in the tip of a 1-meter-long, ½-inch-diameter stainless steel probe that responds to friction sound intensity as the probe tip penetrates the sediment. The microphone is embedded in a ¼-inch Delrin® plastic section (Figure 1) that is designed to acoustically isolate the microphone from the rest of the SED-FSP assembly.
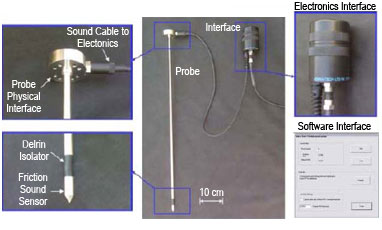
Figure 2. Commercial prototype SED-FSP setup.
The probe is driven into the sediment by a pneumatic piston/cylinder drive unit mounted on an aluminum frame assembly. The SED-FSP probe tip penetrates the sediment at a constant speed to a depth of up to two feet. The probe acquires an acoustic signal, while an onboard camera attached to the frame provides real-time video to help the operator avoid obstructions and ensure that penetration is occurring at a constant rate. The acoustic signal is fed to an onboard electronics package that captures, filters and determines the sound amplitude over a predefined time interval (Figure 2). The processed data is then transmitted to storage and processing software on the operator's computer that displays a plot of the processed signal as a function of time. For surface sediments, grain size is determined by identifying the SED-FSP response output associated with the top sediment layer and calculating the average of the responses. Subsurface sediment grain size is determined by associating SED-FSP output with subsurface depth, which is accomplished by identifying penetration speed and the acoustic response time signature.
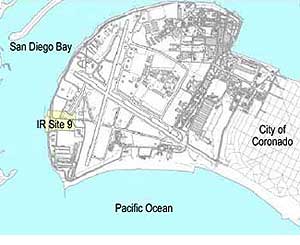
Figure 3. The North Island Naval Air Station ground-surface interaction site location on the shore of the San Diego Bay.
Sites were selected for demonstrations based on potential applications for the SED-FSP. Conditions at Chollas Creek were well-suited for identifying areas of fine sediment, which can be associated with higher contaminant concentrations. IR Site 9 provided a suitable location for identifying potential groundwater discharge points (Figure 3), and the Anacostia River site was selected to help delineate between the thin-layer sand cap and underlying native sediments.
The SED-FSP was deployed at 23 locations at the Chollas Creek site during October 25 - 28, 2010, including three replicate validation stations where additional deployments were made to determine the ability of the system to replicate results. Although some penetration resistance was encountered, less than five minutes was required per deployment once the probe was at a sampling station. Surface sediment grain sizes were determined by averaging SED-FSP responses corresponding to the top six inches of the sediment bed. Samples obtained from all 23 locations also were analyzed using standard methods to validate results obtained using the probe.
At IR Site 9, the SED-FSP was deployed at 123 locations during May 10 - 14, 2011, including three replicate validation stations, along 12 offshore transects encompassing a previously identified groundwater discharge zone. The SED-FSP accurately predicted grain size at all stations except those probed at low tide, when sediment was exposed above the water level. These data points were excluded from the analysis of the results. Several deployment attempts at near-shore locations were abandoned due to resistance to the probe. The vertical profiling capabilities of the probe were also demonstrated at IR Site 9 through development of grain size contour maps at 6-inch depth horizons from zero to 24 inches. The grain size patterns illustrated by the maps were useful in understanding potential groundwater discharge pathways, especially as groundwater approaches the shallow zone.
Thirty-three locations, including one replicate validation station and eight validation sampling stations where sediments were analyzed using conventional methods for comparison to SED-FSP results, were probed using SED-FSP at the Anacostia River site during February 13 - 17, 2012. To determine the location of the interface between cap material and underlying native sediment, a threshold value of SED-FSP response was selected. The SED-FSP was found to accurately identify grain size and cap thickness. The probe accurately measured the intensity of friction sound generated by the sand cap, though it elicited a substantially higher response to underlying native fine sediment. This response was attributed to insufficient acoustic isolation of the probe tip from the probe shaft whose friction is picked up by the microphone sensor, despite the presence of the Delrin isolator.
Prior to each deployment in the field, the SED-FSP was calibrated in the laboratory using constructed sediments of known grain sizes. Pre-deployment calibrations resulted in consistent underestimation of particle size. This underestimation was attributed to the laboratory method used to calibrate the system as well as the well-sorted nature of the calibration sediments — a condition unlikely to be encountered in the field. The underestimation was corrected by applying site-specific power fit to field data, which was empirically derived from the validation sampling results. Data were accumulated across all deployments, and will continue to be accumulated, to arrive at global calibration parameters.
Overall, the SED-FSP met both quantitative and qualitative performance objectives, which focused on rapid, in situ classification of surface sediment type over a broad range of applications and conditions. Demonstration results indicated 92 percent reliability, 85 to 97 percent efficiency, and 90 to 95 percent specificity of the probe, exceeding the target goal of 80 percent for each criterion. The SED-FSP rapidly provided survey maps delineating areas of significance, and successfully identified potential groundwater discharge zones, areas of high fines, and extent and depth of a thin-layer sand cap.
Capital costs for the SED-FSP were $10,000, which are expected to be recouped within the anticipated 5 - 10 year lifespan of the equipment, assuming about 30 uses per year. Maintenance costs are expected to be minimal due to the low complexity of the technology. The main operating costs are associated with labor and the number of personnel required for navigation and equipment handling, which varies depending on the site. In comparing a hypothetical survey using the SED-FSP with a survey employing traditional methods of sample collection and grain size analysis, labor costs were estimated to be similar ($11,280 and $11,050, respectively). The difference in material and analytical costs is more substantial, however, with the costs associated with SED-FSP estimated to be approximately one-fourth those of traditional methods. This is attributed primarily to differences in the number of samples submitted for validation analysis.
Although the SED-FSP is limited to a single characteristic indicator of grain size, advantages include potential cost savings, ability to implement adaptive sampling strategies due to in situ data collection, and cost-effective assessments of remedies such as thin-layer caps and amendments. In the future, the SED-FSP will be deployed at Marine Corps Base Quantico, Virginia, where a thin-layer cap is scheduled to be installed in 2014. The SED-FSP will be used to verify placement of the cap.
New Remediation Technology: Bioreactive Mat for Treatment of Chlorinated Volatile Organic Compounds in Wetlands at Aberdeen Proving Ground, Maryland
Contributed by Michelle M. Lorah, U.S. Geological Survey, Duane Graves, Geosyntec Consultants, and Emily H. Majcher, Bluestone Engineering
The U.S. Geological Survey (USGS) and Geosyntec Consultants, in cooperation with the U.S. Army Garrison at Aberdeen Proving Ground (APG), Maryland, developed and pilot-tested a permeable reactive mat to treat chlorinated volatile organic compounds (VOCs) discharging from groundwater seeps into the tidal wetlands along West Branch Canal Creek at APG. The biomat and dechlorinating microbial consortium ("West Branch Consortium-2" or WBC-2™) used for bioaugmentation were developed specifically for the APG site because of the limited in situ remediation options for sensitive wetland environments. WBC-2 was formulated to enhance natural attenuation processes observed in nearby wetland sediments. The majority of the pilot test occurred from October 2004 through October 2005, with follow-on performance testing in September 2008. One year of monitoring indicated chlorinated methanes, ethanes, and ethenes median mass removal ranging from 94 to 98 percent, while samples collected in 2008 indicated sustained methanogenesis and VOC treatment four years after installation. The WBC-2 culture and reactive mat were developed through a Cooperative Research and Development Agreement between USGS and Geosyntec.
Groundwater in areas of APG is contaminated with a mixture of chlorinated solvents, including 1,1,2,2-tetrachloroethane (TeCA), trichloroethene (TCE), tetrachloroethene (PCE), carbon tetrachloride and chloroform. Total VOC concentrations in shallow groundwater ranged from about 50,000 to just over 100,000 micrograms per liter. Previous investigations indicated that groundwater in these areas discharges through natural wetlands to surface water. In most zones, contaminants seep slowly through the wetlands and are naturally attenuated in the sediments. However, in several localized zones and above areas of the aquifer with dense non-aqueous phase liquid, groundwater seeps rapidly through sediment to surface water without adequate biodegradation or attenuation.
Contaminated groundwater near or beneath wetland sediments strains the viability of many common remedial technologies due to economic and practical issues associated with their construction and operation, particularly if a complementary goal of the remedy is minimal adverse effect on the surrounding wetland ecosystem. Enhanced bioremediation approaches specifically designed for use in wetlands, such as the reactive mat and WBC-2 bioaugmentation culture, require minimal alteration of wetlands, no mechanical equipment, limited maintenance, and effective treatment of chlorinated VOCs.
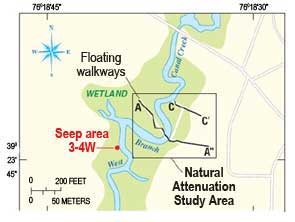
Figure 1. Seep area 3-4W along West Branch Canal Creek at APG.
The reactive mat was designed to optimize chlorinated VOC degradation efficiency without altering the wetland geotechnical and hydraulic characteristics, or creating undesirable water quality. Optimized degradation efficiency was achieved through the selection of a sustainable organic reactive matrix, electron donor, and bioaugmentation method. Consideration of geotechnical compatibility through design calculations of bearing capacity, potential settlement, and geotextile selection showed that a 2- to 3-feet tolerable thickness of the mat was possible, with 0.17 feet of settlement predicted for unconsolidated sediments 1.5 to 6 years following installation.
In October 2004, the mat was installed in seep area 3-4W (Figure 1) by removing the top 12 inches of wetland sediment with a vacuum truck and replacing it with biomat materials. Measuring 22 inches thick, the mat was divided into two reactive zones (Figure 2) — a 10-inch lower zone overlying the sediment designed to enhance abiotic degradation of chlorinated methanes, and a 12-inch upper zone designed to enhance biodegradation of the remaining chlorinated methanes, ethanes, and ethenes. A nonwoven geotextile with a cross-plane flow greater than that of the native sediments was installed as the base of the mat. Another layer of nonwoven geotextile was installed between the upper and lower zones to improve laminar flow conditions.
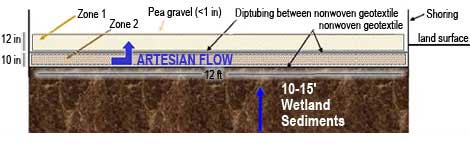
Figure 2. Reactive biomat at APG with an upper organic zone and a lower zone designed to enhance abiotic degradation of contaminants.
To ensure hydraulic compatibility in the mat design, materials selected for the organic reactive matrix had a hydraulic conductivity greater than the surrounding sediments. The matrix is a mix of commercially available nutrient-rich compost (Chesapeake Blue Crab), reed sedge peat and sand in a 1.5: 1.5: 1 ratio to safeguard against fluidization. The organic materials were also analyzed for metal concentrations to evaluate water quality compatibility. The analysis showed that concentrations of metals in the materials ranged from one-half to one order of magnitude below consensus-based probable effect concentrations in sediment.
The presence of chlorinated methanes (carbon tetrachloride and chloroform) in the groundwater prompted augmentation of the lower zone of the biomat with zero-valent iron to promote simultaneous abiotic and biotic degradation. Column experiments used to evaluate possible amendments to the reactive mat showed similar contaminant attenuation efficiency with and without the addition of iron, but it was included in the field test as a safeguard for periods when colder temperatures could decrease microbial activity.
The upper zone of the reactive mat was bioagumented with 0.5 percent WBC-2 culture (currently available as KB-1®Plus) by volume to promote anaerobic biodegradation of contaminants. WBC-2 was developed by enriching wetland sediment collected from the study area where rapid and complete reductive dechlorination naturally occurs. The culture contains up to 21 bacteria phylotypes, including dechlorinating Dehalococcoides and Dehalobacter strains. Bench-scale experiments indicated that WBC-2 is capable of fully dechlorinating TCE, PCE, TeCA, 1,1,2-trichloroethane, cis- and trans-1,2-dichloroethene, 1,1-dichloroethene, and vinyl chloride, to non-chlorinated end-products ethene and ethane. Degradation of RDX and chlorinated benzenes by WBC-2 also was observed.
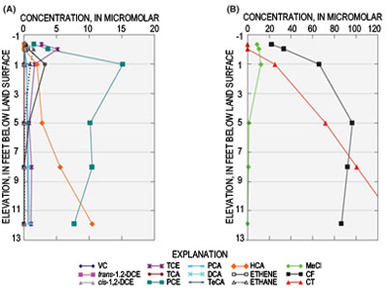
Figure 3. Treatment of chlorinated ethenes and ethanes (A) and chlorinated methanes (B) in seep water by the reactive mat.
The mat was monitored several times per month from November 2004 through September 2005. Samples also were collected once in September 2008 to evaluate performance four years after installation. Monitoring showed rapid onset of and sustained methanogenic conditions conducive to anaerobic biodegradation and dechlorination by WBC-2. Within the 1.5-foot-thick zone between the base of the mat and the middle of the organic zone, a median mass removal of 98 percent of chloromethanes and 94 percent of chloroethenes and ethane was observed during the first year of performance monitoring. Minimal mass removal was observed within the underlying 12- to 15-foot thick wetland sediment. Additionally, water quality monitoring for pH, specific conductance, nutrients, major ions, and metals indicated that the mat did not adversely affect the water in the wetland sediments surrounding the reactive mat, or the nearby surface water.
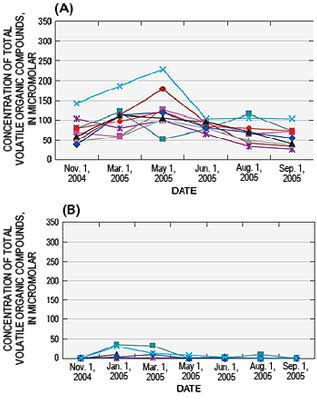
Figure 4. Seasonal changes in total VOC concentration below the reactive mat (A) and in the middle of the mat (B). Individual symbols indicate measurements at different sampling locations in the mat.
Following mat installation, transient appearance of daughter VOCs associated with degradation, including TCE, cis-1,2-dichloroethene, vinyl chloride and methylene chloride, was observed in groundwater within the mat (Figure 3). End products ethene and ethane were also consistently detected in some areas of the mat throughout the monitoring period. An apparent decrease in chlorinated VOC degradation (Figure 4) and methane production occurred in late winter to early spring of the monitoring period, consistent with an anticipated decline in microbial activity during cold weather.
Hydraulic head gradients in and around the reactive mat remained vertically upward at 0.20 to 0.26 feet/foot following mat installation, consistent with pre-installation calculations. Horizontal hydraulic gradients remained at least one to two orders of magnitude lower than the vertical hydraulic head gradients. Despite the dominantly vertically upward head, an aerial thermal infrared flight during winter 2005 showed that the reactive mat was not warmer than surrounding wetland sediments, as observed on flights over the seep area prior to mat installation (Figure 5). Other seep areas in the vicinity of the biomat-treated seep were consistent with previous flight imagery. Porewater sampling indicated that transport of VOCs had not shifted to these nearby seeps indicating that the design goal of normalizing flow across the mat without affecting flow in the surrounding wetland was achieved. Surface elevation measurements showed an average mat surface settlement of approximately 0.25 feet after 10 months, which was near the predicted settlement for unconsolidated sediment.
Overall, the demonstration showed that the design goal of at least 90 percent mass removal of total chlorinated VOCs was achieved and maintained for one year without undesired geotechnical, hydraulic, or water quality effects on the wetland and tidal creek. Monitoring conducted four years after installation confirmed several positive attributes of the technology, including sustained treatment of chlorinated VOCs with no maintenance or addition of amendments required, sustained methanogenesis within the mat, and geotechnical stability of mat materials. In addition, methanogenic conditions were found beneath the mat, which is speculated to have expanded dechlorinating activity. The biomat also had no adverse effects on vegetation, as indicated by a normal pattern of plant succession and similar plant diversity and growth on the biomat compared to the surrounding wetland.
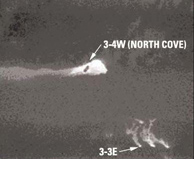
Figure 5. Thermal infrared imagery showing the temperature disparity between two groundwater seep areas and the surrounding environment. The reactive mat was installed on the surface of seep 3-4W.
Since the wetland pilot test, additional bench- and pilot-scale tests have shown that WBC-2 seeded bioreactors can degrade chlorinated VOCs in groundwater treatment plants at APG. The WBC-2 culture combined with lactate injection also has been tested in a fractured rock aquifer at White Sands Missile Range, New Mexico, to validate its use for complete anaerobic degradation of RDX and perchlorate. Current studies are investigating the potential for WBC-2 dechlorination of trichlorobenzene, dichlorobenzene and monochlorobenzene in wetlands at the Standard Chlorine of Delaware, Inc. Superfund site in New Castle County, Delaware.
Previously Published in:
Majcher, E.H., Lorah, M.M., Phelan, D.J., and McGinty, A.L., 2009. Design and performance of an enhanced bioremediation pilot test in a tidal wetland seep, West Branch Canal Creek, Aberdeen Proving Ground, Maryland: U.S. Geological Scientific Investigations Report 2009-5112, accessed May 28, 2014.
Long-Term Performance: Multi-Component Containment System for Contaminated Sediment in North Portland
Contributed by Scott Manzano, Oregon Department of Environmental Quality, and Rich Muza, U.S. Environmental Protection Agency
Cleanup over the past 18 years at the 64-acre McCormick & Baxter site on the shore of the Willamette River in north Portland, Oregon, involves an integrated system of multiple components for contaminant containment. The entire site is capped, with an upland cap that extends to the riparian area along the shoreline where it meets a 23-acre sediment cap beneath the river. The soil and sediment caps operate in conjunction with an impermeable vertical engineered barrier (VEB). Results of the site's third five-year review, which was completed in 2013, indicate the remedy is performing effectively after resolution of problems associated with escape of non aqueous-phase liquid (NAPL) from the river sediment.
McCormick & Baxter Creosoting Company operated at the site between 1944 and 1991, treating wood products with creosote, pentachlorophenol (PCP), and a variety of water- and ammonia-based solutions containing arsenic, chromium, copper and zinc. Process wastewaters were discharged directly to the Willamette River, and other process wastes were dumped in several onsite areas. Site investigations beginning in the late 1980s revealed high concentrations of heavy metals, polycyclic aromatic hydrocarbons, and PCP at depths reaching 80 feet below ground surface (bgs) in soil and groundwater and to 35 feet below the riverbed sediment surface.
Initial cleanup work at this National Priorities List site included excavation and offsite disposal of approximately 32,604 tons of contaminated surface soil and debris. NAPL releases to the subsurface from former aboveground tanks that stored creosote and other wood-treatment chemicals was recovered through a pilot-scale extraction and treatment system in 1989-2000; manual NAPL recovery was then conducted until early 2011. In 2003-2004, a subsurface VEB was constructed to fully encompass 18 acres containing NAPL-impacted groundwater and the main contaminant source areas, including the former tank farm and disposal areas; the total length of the wall is 3,792 linear feet, and the depth varies from approximately 45 to 80 feet bgs.
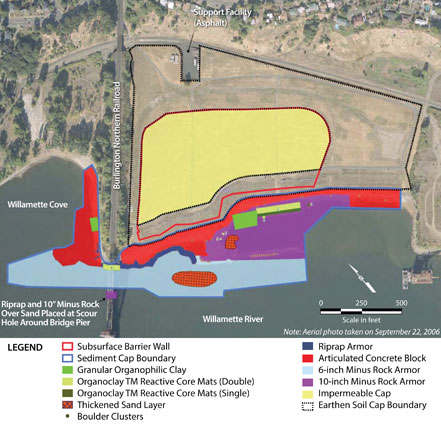
Figure 1. Aerial schematic of multi-component containment system operating at the McCormick & Baxter site.
A RCRA-compliant impermeable cap was then constructed over contaminated soil in an upland area covering approximately 15 of the 18 acres contained within the VEB (Figure 1). The remaining three acres, located in the riparian zone along the river, were covered with an earthen cap as part of the sediment cap construction. Eighteen monitoring wells within the 6-acre riparian zone were abandoned to assure continuity of the cap. Thirty-six other monitoring wells were modified to meet Oregon water resource requirements; for example, well casings were added and surface casings were raised to accommodate the soil cap thickness.
The earthen soil cap consists of a minimum 2-foot-thick layer of imported topsoil installed on 19 acres outside of the VEB area and on an additional six acres of soil in the riparian zone. A swale in the cap conveys stormwater directly to an onsite retention/infiltration pond. Several thousand native trees and shrubs were planted throughout the drainage swale and riparian zone to help stabilize the soil against stormwater erosion and river flood erosion, and to evapotranspire rainwater to reduce percolation into groundwater.
Figure 2. Exposed ACB and sand cap armoring at the McCormick & Baxter site.
The 23-acre sediment cap consists of a 2-foot-thick layer of sand over most of the cap footprint; a 5-foot-thick sand layer was placed in several more highly contaminated areas. Over four months in 2004, approximately 131,000 tons of sand was placed. In the former tank farm area with NAPL seep, as well as the Willamette Cove, the cap incorporated 600 tons of bulk organophilic clay (ET-1 Activated Clay®) to prevent breakthrough of NAPL through the cap. Organophilic clay generally consists of bentonite or hectorite that is modified to increase hydrophobic properties and affinity for organic compounds.
The sediment cap incorporated different types of armoring to prevent erosion of the sand and organophilic clay layers. The specific armoring material and where it was installed depended on the expected hydraulic and physical environments such as currents and wave or erosive energies. Articulated concrete block (ACB) mats were installed along the shoreline and in shallow water where erosive forces would be the greatest due to wave action (Figure 2). Sizing of rock emplaced as armor included 6-inch-minus, 10-inch-minus, and riprap. All shallow water 10-inch-minus and ACB armoring layers were underlain with a woven geotextile fabric and a 4-inch-thick layer of 3-inch-minus filter rock (Figure 3). This fabric and rock layer was installed to hinder sand migration through the larger and more porous armoring layer(s).
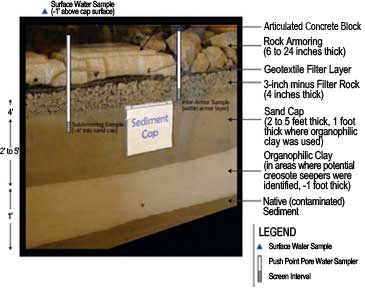
Figure 3. Cross-section of sediment cap installed at the McCormick & Baxter site.
Approximately 23,250 tons of 6-inch-minus cobble were placed over the sand cap and as edge treatment where the 6-inch-minus cobble areas abutted the ACB. Approximately 23,300 tons of angular 10-inch-minus rock were placed in the near-shore embayment. The riprap used for the boulder clusters and the rock mound is composed of durable angular boulders less than 3 feet in diameter. Approximately 558 tons of riprap was placed along the shoreline and on an offshore shoal between the embayment and the river. Each boulder cluster consisted of six to seven boulders.
Installation of the sediment cap was completed in 2005. Post-construction inspections revealed ebullition-induced sheen on surface water directly above the sediment cap. In the following year, sheen also was observed along the site's shoreline. The observations prompted examination of the potential migration pathways for contaminants (Figure 4.)
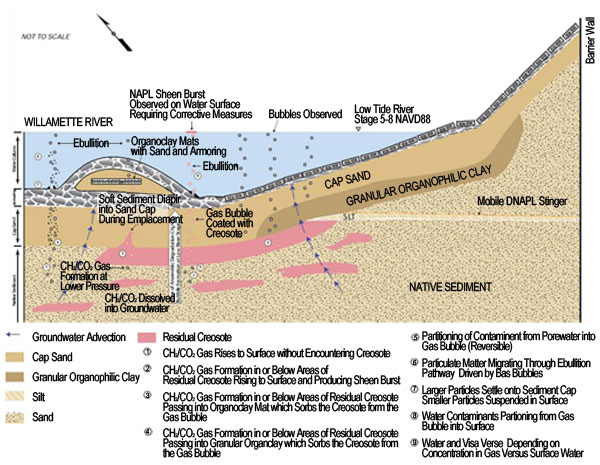
Figure 4. Conceptual Model of Contaminant Transport at the McCormick & Baxter site.
To mitigate the sheen, approximately 24,150 square feet of laminated matting containing Organoclay® (Reactive Core Mat™) was emplaced in three target areas along the shoreline and within shallow near-shore water and covered with sand and rock armoring. A comprehensive study was conducted from 2007-2009 to determine the potential source and nature of the sheen; the study included porewater and sediment core sampling and chemical and biological sheen analysis in the vicinity of sheen observations. Flux chambers were deployed in select locations to collect surface water and air samples. A high correlation was found when comparing observed locations of ebullition/sheen to areas where bulk organophilic clay had been placed in the sediment cap. In these areas, it was determined that degradation of the organic material within the organophylic clay periodically released gas that created a pathway for NAPL to surface water where it was expressed as small but visible sheen bursts. It was concluded that sheens found along the shoreline were most likely due to higher concentrations of iron in groundwater discharge. To date, no further sheen bursts have been observed in surface water, and the rate of ebullition through the cap has diminished significantly.
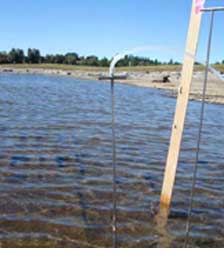
Figure 5. Sample collection in sub-armor of the sediment cap at the McCormick & Baxter site.
Solid phase micro-extraction (SPME) passive samplers were deployed in 2010 at 22 locations overlying the sediment cap and at two background surface water locations to establish a monitoring baseline. Each point was sampled 6 inches into the armoring layer as well as 6 inches and 12 inches into the sand cap layer (Figure 5).
Sediment cap monitoring has also involved several bathymetric surveys and diver inspections. Differencing survey images and inspections led to cap improvements such as placement of additional rock armor and Organoclay reactive core mats in some areas. In addition, visual inspection of the ACB in the sediment cap has revealed gaps in some areas due to accumulation of sharp objects and debris. Significant gaps have been filled with grout; in areas highly susceptible to ongoing wave action, gravel also may be added.
Overall, the sediment cap remains effective, with no evidence of significant contaminant breakthrough to the near surface environment. Mean concentrations of carcinogenic polycyclic aromatic hydrocarbons (cPAHs) in surface water, for example, decreased from 0.33 micrograms per liter (ug/L) in 2002 to 0.015 ug/L in 2010 (Figure 6).
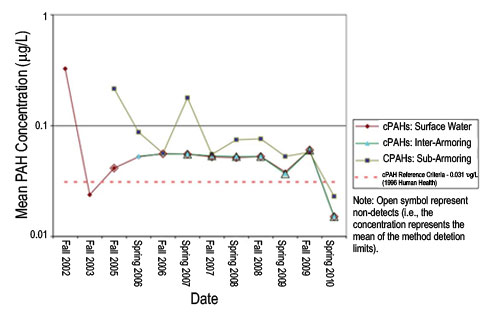 Figure 6. Mean concentrations for total cPAH in surface water, inter-armor water (collected within the rock armor), and sub-armor (sand cap) water of the sediment cap at the McCormick & Baxter site.
Through a U.S. EPA grant received in 2014, Oregon State University researchers will soon begin to measure Williamette River contaminants within the Portland Harbor Superfund site. Passive sampling techniques in water and sediment can better assess pollutant concentrations in specific locations over time. Oregon State University is currently working on a plan to use passive samplers at McCormick and Baxter to determine sediment cap performance as part of the next five-year review to ensure that the remedy remains functional and protective as designed. That sampling will be conducted in late summer 2015.
RESOURCES
CLU-IN Website: Sediments
The sediments issue area of CLU-IN bundles information relevant to site cleanup involving contaminated sediments, including key policy and guidance, conceptual site models, fate and transport (including groundwater-surface water interactions), site characterization and risk assessment. This issue area also provides links to information resources on remedies such as capping, dredging, and excavation and related strategies such as institutional controls or monitored natural attenuation.
New Webinar Series: Porewater Concentrations and Bioavailability
The U.S. Environmental Protection Agency (EPA) offers a four-part webinar series on why, how, and when to measure porewater concentrations and bioavailability as part of contaminated sediment assessment and management. The webinar series is hosted jointly by EPA's Contaminated Sediments Forum and the National Institute of Environmental Health Science's Superfund Research Program. Upcoming webinars will address metals and passive sampling devices (PSDs) (session III on December 1, 2014) and PSDs for organic contaminants (session IV on December 15, 2014). Sessions I and II, offered previously, will be archived soon on CLU-IN.
EPA Directive: Use of Amendments for In Situ Remediation at Superfund Sediment Sites
EPA compiled this report (OSWER Directive 9200.2-128FS) to introduce project managers and other cleanup stakeholders to the most promising amendments for in situ remediation of sediments and to summarize information on contaminated sediment sites that have already employed these amendments. The report addresses the use of amendments alone and in conjunction with a conventional isolation cap or a thin-layer cap and enhanced monitored natural recovery. The amendments are designed to treat hydrophobic organic contaminants, metals or both and in some cases reduce risks from NAPL. The report also discusses associated costs, placement methods and design considerations such as contaminant fate and transport pathways, amendment characteristics and computer modeling.
New ITRC Guidance: Contaminated Sediments Remediation; Remedy Selection for Contaminated Sediments
The Contaminated Sediments Team of the Interstate Technology & Regulatory Council (ITRC) recently released this comprehensive guidance document to offer a remedy selection framework that can help project managers evaluate remedial technologies for contaminated sediments and develop remedial alternatives based on site-specific data. Technologies covered include monitored natural recovery and enhanced monitored natural recovery, in situ treatment, capping and dredging/excavation. The document addresses design considerations, data needs and monitoring for each technology. As a general reference, this document provides a framework with elements that are subject to pertinent federal or state laws and regulations such as those governing Superfund site cleanup.
ICES Technical Report Series on Chemical and Biological Measurements: Determination of Polychlorinated Biphenyls (PCBs) in Sediment and Biota
This series of technical reports, developed by the International Council for the Exploration of the Sea (ICES), describes methods and procedures relating to chemical and biological measurements in the marine environment. Most of the techniques were selected for documentation based on performance in ICES or other inter-calibration or inter-comparison efforts. Determination of Polychlorinated Biphenyls (PCBs) in Sediment and Biota (No. 53) provides advice on the analysis of PCBs in sediment and biota and addresses sampling and sample handling, analytical methods, instrumental analysis and quality assurance. The ICES is a global network of more than 4,000 scientists working to inform decision-makers on the sustainable use of the marine environment and ecosystems.
Contact Us:
Suggestions for articles in upcoming issues of Technology News and Trends may be submitted to
Linda Fiedler via email at fiedler.linda@epa.gov.
Past Issues:
Past issues of the newsletter are available at http://www.clu-in.org/products/newsltrs/tnandt/.
Archives | Subscribe | Change Your Address | Unsubscribe