
Geophysical Methods
Gamma Logging
Gamma radiation occurs naturally in the soil and rocks that make up the strata below ground. Different materials emit gamma radiation1 at different rates. Gamma logging (natural gamma ray logging2 and spectral gamma logging3) is used to detect background radiation in the subsurface.
To measure the rates, a field crew lowers the natural gamma tool or spectral gamma tool by wireline to the bottom of the borehole, allows the tool to equilibrate with the subsurface temperature, and then reels the tool back up at a steady rate. As the tool is reeled up, it continuously measures the total gamma radiation being emitted by the surrounding subsurface materials. Patterns of heterogeneity can be inferred from both the gamma count itself and the rate of change in the gamma counts as the tool moves from one stratum to the next. This information may indicate preferential pathways for contaminant migration. A gamma logging tool can be used in tandem with other borehole tools to collect a suite of measurements that can help identify and locate confining clay layers, radioactive material, and potential preferential flow areas around the borehole.
Typical Uses
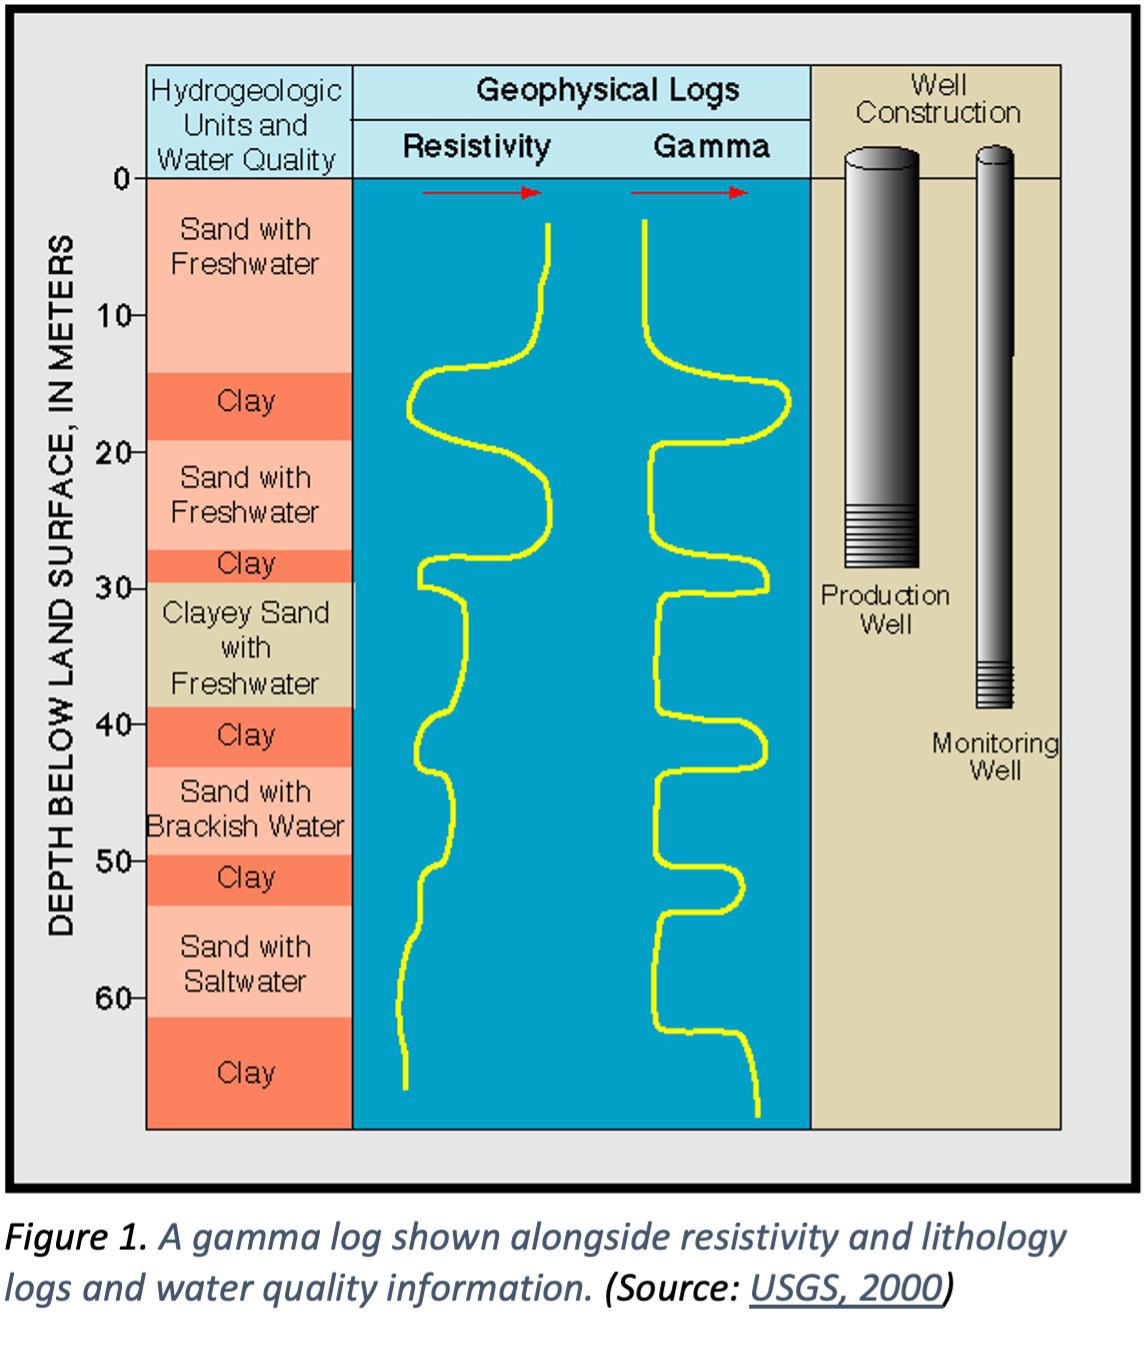
Figure 1. A gamma log shown alongside resistivity and lithology logs and water quality information (Source: USGS, 2000).
Because certain rock types and minerals can be differentiated by their characteristic gamma-emitting signatures, both the natural gamma logging and spectral gamma logging tools are useful in characterizing the lithology in the immediate vicinity of the borehole. For example, clays contain gamma-emitting potassium and tend to concentrate uranium and thorium, if present. Geologic units with abundant clay content can be identified versus those composed primarily of quartz sand and carbonate material by gamma logging. As shown in Figure 1, gamma logging provides an efficient method for determining the placement of casings and screens in water supply wells and in wells used to characterize and remediate contaminated groundwater. High gamma readings are interpreted as zones of low effective porosity and low permeability.
Because spectral gamma data can be used to identify and determine the concentrations of uranium, thorium, and potassium-40 isotopes in boreholes, they can be used to estimate percentages of mineral types in bedrock adjacent to the borehole, calculate shale percentages, and identify clay mineral types. This is important for developing an environmental sequence stratigraphy model4 to depict a more realistic subsurface.
Potential Applications of Natural Gamma and Spectral Gamma Logging Tool*
| Lithology/Stratigraphy/Formation Properties | Contaminant Characterization |
| Thickness of geologic unit Clay/shale content (i.e., low permeability zones) Relative sand-shale content (i.e., preferential flow paths) Geochemistry (Spectral gamma) |
Radioactive contaminants (Spectral gamma) Dispersion, dilution, and movement of waste (gamma logs for some radioactive wastes) |
* From Table 7-2, EPA 1993.
↩Theory of Operation
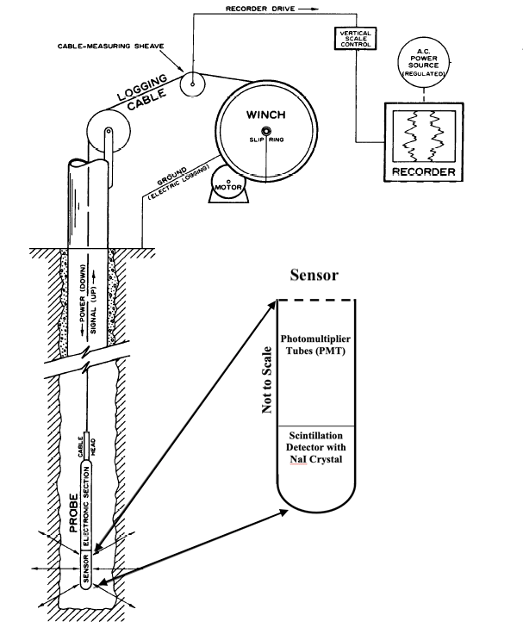
Figure 2. In this generalized schematic of a gamma logging tool, a scintillation detector composed of a NaI crystal is connected to a series of photomultiplier tubes to the signal so that it may be recorded (modified from Keys, W. and L. MacCary, 1985).
The gamma logging tool uses a sensor containing a scintillation detector composed of a sodium iodide (NaI) crystal to absorb gamma radiation and emit light. When gamma rays from a material strike the NaI crystal as the gamma logging tool is being pulled up the borehole, the Nal crystal releases a photon of light. The photons of light are amplified by a photomultiplier tube (PMT) optically connected to the crystal. Several PMTs are used to amplify the signal sufficiently so that it can be counted at the surface. Figure 2 is a simple illustration of the scintillation detector (NaI crystal) relative to the PMTs contained within a sensor on the gamma logging tool. Gamma emissions from natural materials fluctuate; thus responses are averaged over a fixed period to account for this temporal variability.
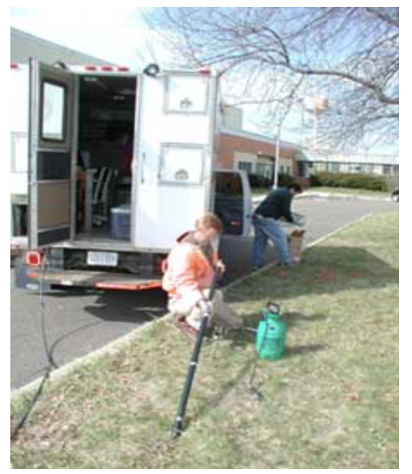
Figure 3. Spectral gamma logging tool used to survey at a Naval Air Warfare Center (NAWC) research site (Source: USGS).
The spectral gamma logging tool (Figure 3) is a refinement of the gamma logging tool. Like the natural gamma logging tool, a spectral gamma tool uses a sensor that contains a scintillation detector, composed of either NaI or cesium iodide (CsI) (USGS). As shown in Figure 3, the scintillation detector is coupled with PMTs within the logging tool. The crystal in the scintillation detector releases a photon of light when struck by gamma radiation as the sensor contained on the tool is pulled up the borehole. In addition to measuring the total gamma emitted by a material, the spectral gamma detector records the energy level of each pulse of light and counts the number of gamma emissions associated with each energy level. The energy level of the pulse of light is proportional to the energy of the gamma radiation that triggers the pulse of light. Because potassium, uranium, and thorium each have an identifying energy level (spectral signature), the spectral gamma tool can be used to estimate their concentrations in the subsurface. These potassium, uranium, and thorium data can be used, for example, to identify mineral types and their percentages in bedrock, calculate the percentage of shale, map clay content, and identify clay depositional environments. This information can then be used to identify permeable/less permeable zones that may influence contaminant migration.
↩System Components
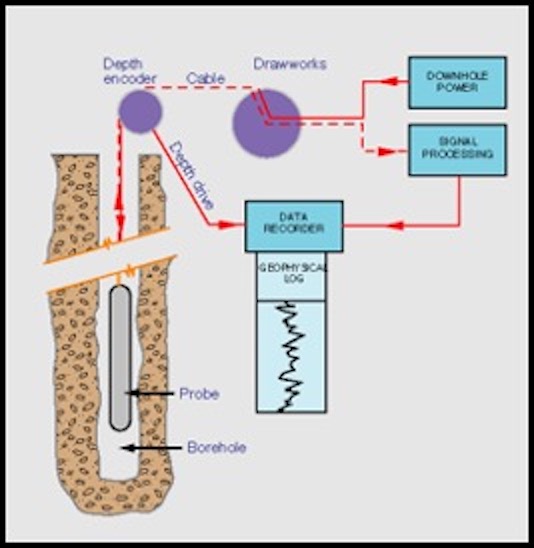
Figure 4. A generalized schematic of a geophysical logging system (Source: USGS).
Gamma logging tools are deployed using a geophysical logging system (Figure 4) consisting of probes, cables and drawworks; power and processing modules; and data recording units. Most systems currently in use are computer-controlled, allowing the collection of multiple logs in one pass. Gamma probes are typically paired with other geophysical tools like resistivity (Figure 1) on the string to obtain a suite of measurements in a single pass.
↩Modes of Operation
Gamma logging tools are deployed downhole in either open holes5 or cased holes.6 The geophysical logging systems can be truck-mounted or can be portable, battery-powered systems specifically designed for environmental investigations. Both total gamma logging and spectral gamma logging can be used in the boreholes that are air-filled, water-filled, mud-filled, open, plastic-cased, or steel-cased. The minimum hole diameter range is typically 2 inches (from Table 7-1, EPA, 1993).
↩Data Display and Interpretation
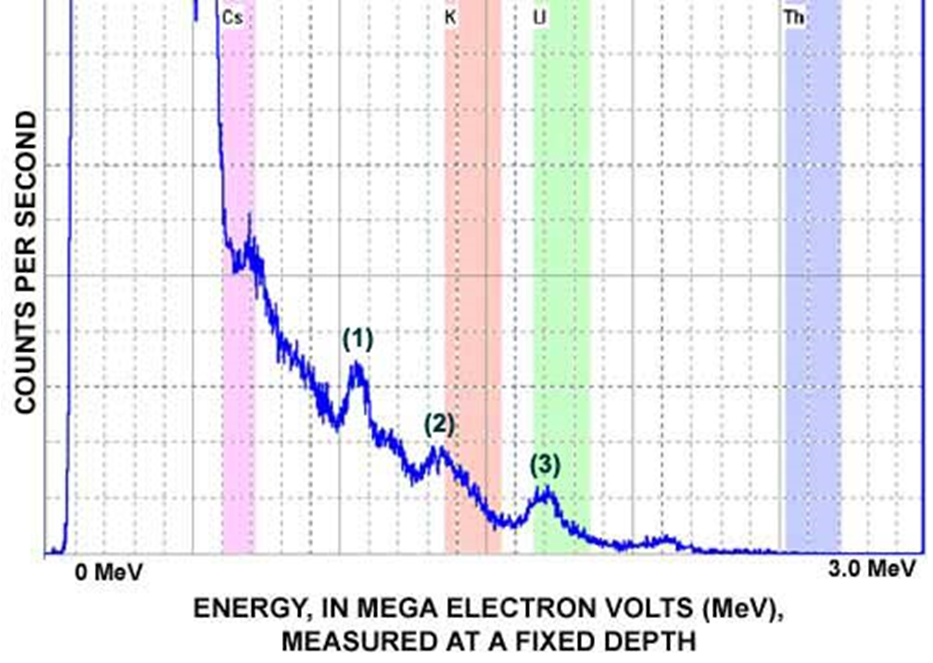
Figure 5. Plot of sample gamma energy spectrum (Source: USGS).
Data are collected from either a fixed location within the borehole or by logging at slow speeds as the probe is drawn up the borehole. Logging speed is adjusted based on the range of gamma emission, where a slower logging speed is required if gamma emissions are low. Data collected by the spectral gamma tool from a single location within the borehole are plotted to show counts of emission for each channel of the spectrum. Data collected using both the regular gamma and the spectral gamma tool are plotted as total counts of emission.
Figure 5 depicts spectral gamma data from a single location within a borehole, where counts per second are plotted on the vertical axis, and energy levels, in mega (or millions) electron-volts (MeV),7 are plotted on the horizontal axis. Peaks in the data represent different elements or minerals within the formation at that location in the borehole. The first peak located between the cesium (Cs) and potassium (K) windows corresponds to bismuth. The second peak partially overlapping the K window is interpreted as K-40. The third peak located in the uranium (U) window corresponds to uranium disintegrations. In this location, there were no detections of energy levels associated with thorium (Th).
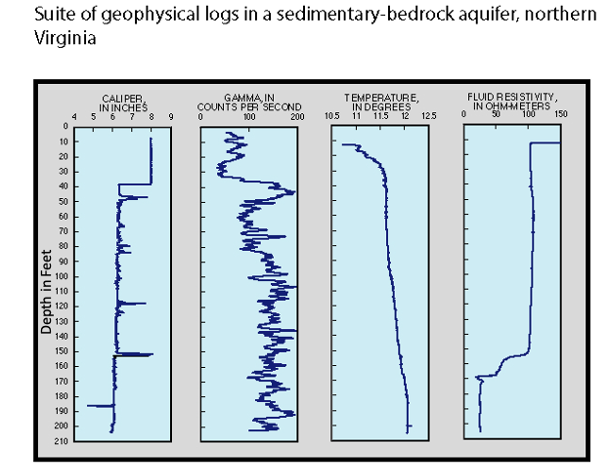
Figure 6. A natural gamma log as part of a suite of logs collected in a borehole (Source: USGS).
Concentrations of the detected elements can be calculated using post-processing software. As noted in Theory of Operation, determining the presence and concentration of the elements in the formation provides information for determining the permeability of the formation and potentially identifying zones where contamination may migrate more readily (USGS).
Figure 6 depicts a suite of geophysical logs, including a natural gamma log, collected in a sedimentary bedrock aquifer. Total gamma count data are plotted along the horizontal axis in counts per second. Depth relative to the top of the borehole is plotted on the vertical axis. Peaks to the right side of the gamma log suggest strata with higher clay content.
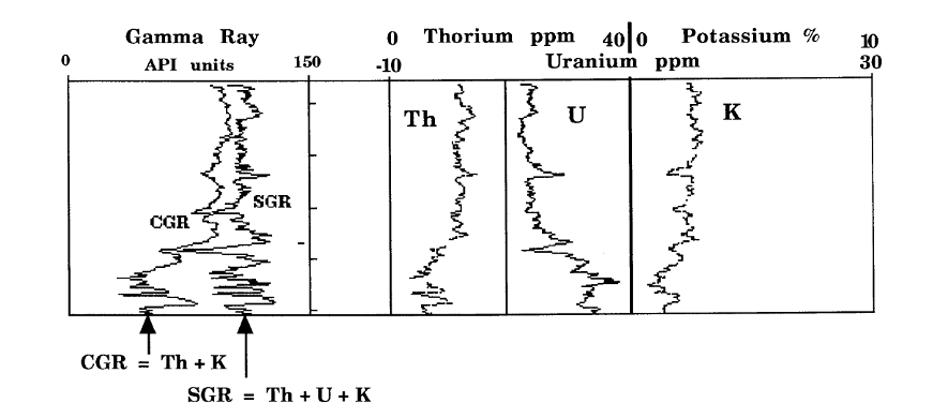
Figure 7. An example of a spectral gamma log (Source: Doverton, J., 2017).
As described in the Theory of Operation section, the spectral gamma logging tool collects data on the energy level (spectral signature) and the counts per energy level, which allows the user to determine the presence and relative amounts of the radioactive elements potassium, thorium, and uranium. The logs of the spectral gamma tool are generally more comprehensive than natural gamma log data, including profiles of thorium and uranium concentrations and percentage of potassium. In Figure 7, three tracks are presented (from left to right): 1) the calculated gamma ray (CGR), which is the sum of the potassium and thorium responses minus the contribution from uranium, and standard gamma ray (SGR) from all gamma sources (these data are reported in units of radioactivity denoted as American Petroleum Institute [API] units); 2) thorium and uranium concentrations in parts per million (ppm); and 3) potassium as a percentage. The potassium percentage is calculated by subtracting the sum of the thorium and uranium concentrations from the total gamma concentration and then dividing that difference by the total gamma concentration. Relative amounts of thorium uranium and potassium can help correlate clay layers across multiple boreholes, helping the user fill the gaps between investigation points.
↩Performance Specifications
Performance specifications for gamma logging tools are listed in Table 1.
Table 1. Performance Specifications for Gamma Logging
| Parameter | Unit of Measurement | Typical Range |
| Accuracy | NA | 5-10%1 |
| Time Constant | Seconds (s) | 1-52 |
| Logging Speed | Feet per second (ft/s) | 12, 3 |
| Depth of Investigation | Inches (in) | 6-162,4 |
| Vertical Resolution | Feet (ft) | 2-32,4 |
| Depth of Survey Below Land Surface | Feet (ft) | Depth of borehole |
1 Sources: CBG Corp., Hunting Energy Services, Schlumberger, Weatherford
2 Source: Collier, 1993
3 Natural gamma tools are typically run at speeds based on one foot of movement during the time constant. If the time constant is 1 second, then the logging speed would be 1 ft/s or 3,600 ft/h. If the time constant is 2, then the logging speed would be 0.5 ft/s or 1,800 ft/h (Collier, 1993). For spectral gamma logging tools, the speed is much slower as the tool must remain at a fixed location for several minutes to collect a representative sample (USGS).
4 Source: AAPG WIKI
Accuracy – The gamma photons emitted by the subsurface material have a Poisson8 distribution where the standard deviation is equal to the square root of the number of disintegrations recorded:
$$ \sigma=\sqrt{\lambda} $$
Therefore, accuracy of the measurements can be calculated. As count rates or the measurement period increase, accuracy increases (Blum, P., 1997), i.e. the slower you reel up the logging tool, the more accurate the readings. Back to Table
Time Constant – The time constant (Tc) is the time, in seconds, during which the pulses are averaged to yield the count rate. As Tc increases, the unpredictable fluctuations in the gamma emissions are smoothed out, leading to better quality log data. However, a large Tc has implications for the vertical resolution of the log data. The vertical resolution of the tool is the product of logging speed (ft/s) times Tc (s). If Tc is too large, this will lead to an increase in the vertical resolution and smearing of bed boundaries (Hoppie, B.W., P. Blum and Shipboard Scientific Party, 1994). Back to Table
Logging Speed – Because gamma emissions are random, the logging tool needs to pause long enough to collect enough counts to average out the fluctuations. Low logging speeds increase the quality of the log data (Collier, H., 1993). Back to Table
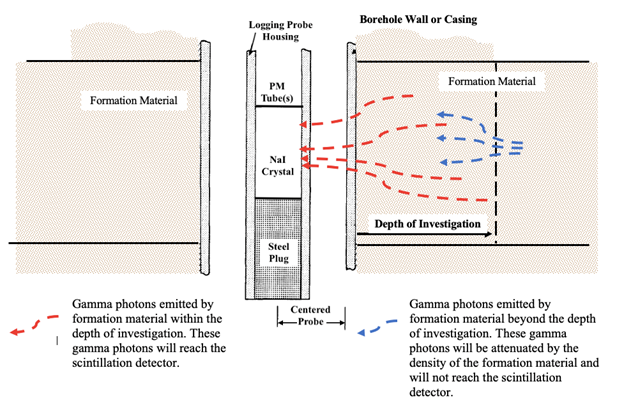
Figure 8. The depth of investigation of the gamma logging tool is controlled by the density of the formation material beyond the borehole (modified from Schimschal, U., 1981).
Depth of Investigation – The depth of investigation (Figure 8) is the depth that the gamma logging tool measures into the formation beyond the borehole which produces 90% of the gamma photons detected. This is because not all the gamma photons created by the radioactive decay of material within the formation will reach the detector. As gamma photons pass through the formation material, between the source of the gamma photons (the decaying radionuclides) and the scintillation detector on the logging tool, they interact with charged particles, causing the gamma photons to lose energy. The denser the material between the source and the scintillation detector, the greater the energy loss and attenuation of the gamma photons. Most of the gamma photons emitted by material in the formation beyond the depth of investigation will be attenuated before they can be detected by the sensor on the logging tool. Therefore, the depth of investigation into the formation beyond the borehole depends on the density of the formation surrounding the borehole and the density of any drilling fluid present in the hole (Keys, W.S., 1989). The depth of investigation typically ranges from 6 to 16 inches. For average values of formation material and drilling fluid, the depth of measurement is approximately one foot (AAPG). Back to Table
Vertical Resolution – Vertical resolution is affected by the size of the sensor, the effects of Tc, and by the horizontal and vertical sensitivity of the sensor. Vertical resolution is the product of logging speed in feet per second times Tc (in seconds). If the logging speed is too fast, details of the thinner layers of strata are lost (Collier, 1993), and strata boundaries smear. Back to Table
Depth of Survey Below Land Surface – The potential vertical depth limit below ground surface of the gamma logging survey is limited only by the depth of the borehole. Back to Table
↩Advantages
The main advantage of natural gamma and spectral gamma logging probes is their versatility for use in any cased or uncased boreholes and in either dry or wet holes. No corrections to the measurements are necessary when looking at relative changes in signal from one stratum to the next. Data are useful for correlating lithology and stratigraphy. Clay content, mineral type, and inferred effective porosity can also be estimated using these tools. In addition, no specialized training is required for gamma logging.
↩Limitations
Gamma logging is limited to borehole deployment. Probes must be properly calibrated to compare logs. Because crystal size and electronic configurations affect the count rates of the probe, probes with different size crystals or different electronics may generate count rates that vary considerably even when collected at the same stratigraphic location. If the data are to be used quantitatively, it is necessary to correct for hole diameter, casing thickness/composition, and drilling fluid density. Typical gamma ray counts have been correlated to certain sedimentary rock types. But knowledge of the local mineralogy is needed to determine whether these correlations hold true when analyzing the gamma logs at a particular site. For example, high gamma ray counts are usually associated with shales or high clay content. However, sedimentary rocks that are feldspathic or micaceous also have high gamma counts due to the high potassium concentrations associated with those minerals (Collier, 1993). A site geologist or geophysicist should interpret the gamma logs for lithologic and stratigraphic correlations across a site, in conjunction with lithologic logs and other geophysical logs.
↩Cost
Daily rental rates are wide ranging for borehole systems. A common system includes the winch, and basic Natural Gamma - Resistivity - Self Potential probe, and costs about $170 (USD) per day. Additional probes are from about $50 up to about $175 (USD) per day. Shipping costs are a consideration due to the length of probes and weight of the system. A contractor may charge about $1,150 (USD) per day plus logging fees per foot. Typical logging rates are about 10 feet per minute depending on resolution and probe used.
↩Case Studies
![]() Innovations In Site Characterization: Geophysical Investigation at Hazardous Waste Sites (EPA-542-R-00-003)
Innovations In Site Characterization: Geophysical Investigation at Hazardous Waste Sites (EPA-542-R-00-003)
U.S. EPA. August 2000
This document describes several geophysical technologies and methods used at 11 hazardous waste sites. Geological settings and the types of contamination at the site varied significantly.
![]() Tools and Data Acquisition of Borehole Geophysical Logging for the Florida Power & Light Company Turkey Point Power Plant in Support of a Groundwater, Surface-Water, and Ecological Monitoring Plan, Miami-Dade County, Florida
Tools and Data Acquisition of Borehole Geophysical Logging for the Florida Power & Light Company Turkey Point Power Plant in Support of a Groundwater, Surface-Water, and Ecological Monitoring Plan, Miami-Dade County, Florida
Wacker, M.A.
U.S. Geological Survey Open-File Report 2010-1260, 5pp. 2010
This report discusses the use of borehole geophysical logging tools used to obtain logs from selected exploratory boreholes in the vicinity of the Florida Power & Light Turkey Point Power Plant. The logging methods, properties measured, type of data obtained, and calibration information are summarized.
![]() Geophysical Logs and Water-Quality Data Collected for Boreholes Kimama-1A and -1B, and a Kimama Water Supply Well near Kimama, Southern Idaho
Geophysical Logs and Water-Quality Data Collected for Boreholes Kimama-1A and -1B, and a Kimama Water Supply Well near Kimama, Southern Idaho
Twining, B.V., and R.C. Bartholomay
U.S. Geological Survey Data Series 622 (DOE/ID 22215), 18 pp. 2011.
Scientists from the U.S. Geological Survey's Idaho National Laboratory Project Office collected water samples and conducted geophysical logging at the borehole located near Kimama, Idaho. The borehole was part of the Snake River Scientific Drilling Project, the goals of which included to study the interaction between the Earth's crust and mantle, to identify potential geothermal energy sources, and to track the evolution of the Yellowstone hotspot on the Snake River Plain. Geophysical logs for the divergent boreholes, Kimama-1A and -1B, were collected from land surface to 976 and 2,498 feet below land surface (BLS), respectively. The geophysical logs included natural gamma, neutron, and gamma-gamma dual density, and gyroscopic analysis. Water samples were collected from Kimama-1A at depths of 460 and 830 feet BLS and from the Kimama Water Supply (KWS) well located approximately 75 feet away.
Conceptual Site Model Development Using Borehole Geophysics at the Savage Municipal Water Supply Superfund Site in New Hampshire
Fuller, Andrew M., Soukup, James, and Richards, Kenneth A.
ITRC Case Study, 2019
At the Savage Municipal Water Supply Superfund Site in Milford, New Hampshire, where groundwater is impacted with tetrachloroethene, bedrock groundwater monitoring wells were installed, and a suite of geophysical methods were used to further characterize the lithologic and aquifer properties. The case study summarizes the characterization efforts at the site to update the conceptual site model.
↩References:
American Association of Petroleum Geologist (AAPG), 2019. AAPG Wiki: Open Hole Tools. Consulted May 2019.
Blum, P. 1997. ![]() Physical Properties Handbook: A Guide to the Shipboard Measurement of Physical Properties of Deep-Sea Cores, Chapter 5. Natural Gamma Radiation. College Station, Texas.
Physical Properties Handbook: A Guide to the Shipboard Measurement of Physical Properties of Deep-Sea Cores, Chapter 5. Natural Gamma Radiation. College Station, Texas.
Collier, H. A., 1993. ![]() Report 343, Borehole Geophysical Techniques for Determining the Water Quality and Reservoir Parameters of Fresh and Saline Water Aquifers in Texas, Volume I of II. Texas Water Development Board.
Report 343, Borehole Geophysical Techniques for Determining the Water Quality and Reservoir Parameters of Fresh and Saline Water Aquifers in Texas, Volume I of II. Texas Water Development Board.
Doverton, J., 2017. Geological Log Analysis. Kansas Geological Survey
DTSC, California EPA, 2012. ![]() Application of Borehole Geophysics at Contaminated Sites; Guidance Manual for Groundwater Investigations.
Application of Borehole Geophysics at Contaminated Sites; Guidance Manual for Groundwater Investigations.
EPA, 1993. ![]() Use of Airborne, Surface, Borehole Geophysical Techniques at Contaminated Sites, A Reference Guide EPA/625/R-92/007, September.
Use of Airborne, Surface, Borehole Geophysical Techniques at Contaminated Sites, A Reference Guide EPA/625/R-92/007, September.
EPA, 2017. A Practical Guide for Applying Environmental Sequence Stratigraphy to Improve Conceptual Site Models EPA/600/R-17/293, September
Hoppie, B.W., P. Blum and Shipboard Scientific Party, 1994. ![]() Natural Gamma-Ray Measurements on OPD Cores; Introduction to Procedures with Examples from LEG 150. Proceedings of the Ocean Drilling Program Initial Reports, Vol 150.
Natural Gamma-Ray Measurements on OPD Cores; Introduction to Procedures with Examples from LEG 150. Proceedings of the Ocean Drilling Program Initial Reports, Vol 150.
ITRC, 2019. Borehole Geophysics - Natural Gamma Logging.
Key, W.S., 1989. Borehole Geophysics Applied to Ground-water Investigations. U.S. Geological Survey.
Keys, W.S., and L.M. MacCary, 1985. ![]() Application of Borehole Geophysics to Water-Resources Investigations. Techniques of Water-Resources Investigations, Book 2, Chapter E1. U.S. Geological Survey.
Application of Borehole Geophysics to Water-Resources Investigations. Techniques of Water-Resources Investigations, Book 2, Chapter E1. U.S. Geological Survey.
Schimschal, U., 1981. Mathematical Model of Gamma-Ray Spectrometry Borehole Logging for Quantitative Analysis Open-File Report 81-402. U.S. Geological Survey.
Schlumberger, 2021. Oilfield Glossary. Website consulted May 2021.
U.S. Bureau of Reclamation, 2001. Engineering Geology Field Manual, Vol 2 - Chapter 14.
USGS. Borehole Geophysics - New York Water Science Center, U.S. Geological Survey.
USGS. Spectral Gamma Borehole Logging - Water Resources, U.S. Geological Survey
U.S. Army Corps of Engineers, 1995. ![]() Geophysical Exploration for Engineering and Environmental Investigations.
Geophysical Exploration for Engineering and Environmental Investigations.
Helpful Information
-
Materials in the subsurface may contain radioactive elements. Some of these elements are unstable and go through a process called radioactive decay. Radioactive decay releases ionizing radiation which can include alpha particles, beta particles, and gamma rays. The primary sources for gamma rays are potassium-40 and the uranium and thorium decay series. Potassium-40 emits gamma radiation as it decays into two stable isotopes (argon and calcium). The uranium decay series consists of about a dozen radioactive daughter products before it decays to the stable lead isotope. The thorium decay series consists of about 10 radioactive daughter products before decaying to a stable lead isotope. These radioactive elements are found in minerals contained by igneous and sedimentary rocks. Radioactive elements occur in soils as either residual or secondary deposits. Both uranium- and thorium-bearing minerals are heavy so concentrate in depositional environments where coarser grained material is found. Secondary deposits are formed when uranium is leached during chemical weathering processes. Uranium mobilized by water in the subsurface is precipitated under reducing conditions. ↩
Materials in the subsurface may contain radioactive elements. Some of these elements are unstable and go through a process called radioactive decay. Radioactive decay releases ionizing radiation which can include alpha particles, beta particles, and gamma rays. The primary sources for gamma rays are potassium-40 and the uranium and thorium decay series. Potassium-40 emits gamma radiation as it decays into two stable isotopes (argon and calcium). The uranium decay series consists of about a dozen radioactive daughter products before it decays to the stable lead isotope. The thorium decay series consists of about 10 radioactive daughter products before decaying to a stable lead isotope. These radioactive elements are found in minerals contained by igneous and sedimentary rocks. Radioactive elements occur in soils as either residual or secondary deposits. Both uranium- and thorium-bearing minerals are heavy so concentrate in depositional environments where coarser grained material is found. Secondary deposits are formed when uranium is leached during chemical weathering processes. Uranium mobilized by water in the subsurface is precipitated under reducing conditions. ↩
-
Regular natural gamma logging measures the total count gamma rays emitted by the subsurface materials. Individual radioisotopes of potassium-40 and the uranium and thorium decay series are not differentiated. ↩
-
Regular natural gamma logging measures the total count gamma rays emitted by the subsurface materials. Individual radioisotopes of potassium-40 and the uranium, and thorium decay series are not differentiated. ↩
-
The spectral gamma tool is a refinement of the natural gamma logging tool. The decay of each of the radioactive isotopes emits gamma rays with a characteristic energy level. The spectral gamma tool records the number of energy pulses and the energy level associated with each pulse. Using this information, the concentrations of potassium, uranium, and thorium can be estimated. ↩
The spectral gamma tool is a refinement of the natural gamma logging tool. The decay of each of the radioactive isotopes emits gamma rays with a characteristic energy level. The spectral gamma tool records the number of energy pulses and the energy level associated with each pulse. Using this information, the concentrations of potassium, uranium and thorium can be estimated. ↩
Environmental sequence stratigraphy (ESS) interprets environmental datasets using the concepts of sedimentary rock formation. Using this method to evaluate data collected for contaminated groundwater investigations helps identify and define aquifer heterogeneities that may impact remediation and the movement of contaminated groundwater. For guidance on using ESS to characterize heterogeneities, see EPA's Best Practices for Environmental Site Management: A Practical Guide for Applying Environmental Sequence Stratigraphy to Improve Conceptual Site Models (2017). ↩
Environmental sequence stratigraphy (ESS) interprets environmental datasets using the concepts of sedimentary rock formation. Using this method to evaluate data collected for contaminated groundwater investigations helps identify and define aquifer heterogeneities that may impact remediation and the movement of contaminated groundwater. For guidance on using ESS to characterize heterogeneities, see EPA's Best Practices for Environmental Site Management: A Practical Guide for Applying Environmental Sequence Stratigraphy to Improve Conceptual Site Models (2017). ↩
Open holes are those drilled into formation material that is competent enough that it will not collapse or cave into the drilled borehole. Bedrock boreholes are typically open hole. Unconsolidated formation material requires a well casing to be installed in order to keep the formation material from collapsing into the hole. ↩
Open holes are those drilled into formation material that is competent enough that it will not collapse or cave into the drilled borehole. Bedrock boreholes are typically open hole. Unconsolidated formation material requires a well casing to be installed in order to keep the formation material from collapsing into the hole. ↩
Boreholes that are not open hole are cased with either PVC or metal casing. The casing material is used to keep formation material from collapsing into the drilled borehole. ↩
Boreholes that are not open hole are cased with either PVC or metal casing. The casing material is used to keep formation material from collapsing into the drilled borehole. ↩
Energy of radiation electron volts, millions of electron volts (MeV). As radioisotopes decay, they emit energy that is measured in electron volts, in this case millions of electron volts (MeV) (Keys, W.S. and L.M. MacCary, 1985). ↩
Energy of radiation electron volts, millions of electron volts (MeV). As radioisotopes decay, they emit energy that is measured in electron volts, in this case millions of electron volts (MeV) (Keys, W.S. and L.M. MacCary, 1985). ↩
Poisson distribution is defined as a discrete frequency distribution that gives the probability of a number of independent events occurring in a fixed time. ↩
Poisson distribution is defined as a discrete frequency distribution that gives the probability of a number of independent events occurring in a fixed time. ↩