
Characterization and Monitoring
What Is HRSC?
EPA’s definition of HRSC is:
- High-resolution site characterization (HRSC) strategies and techniques use scale-appropriate measurement and sample density to define contaminant distributions, and the physical context in which they reside, with greater certainty, supporting faster and more effective site cleanup.
Enhanced Details — HRSC is designed and implemented to collect environmental measurements at the appropriate scale of the heterogeneities in the subsurface which control contaminant distribution, transport and fate. These heterogeneities occur at scales that are often too small for conventional investigation strategies and technologies to adequately characterize. Conventional technologies originally used to assess water resource availability and subsequently characterize contaminated sites, typically assess heterogeneities that are on the scale of tens of meters, while heterogeneities that control contaminant transport are on the centimeter to meter scale. HRSC is a highly effective strategy to obtain the detailed geologic, hydrogeologic and contaminant information necessary to select and design remedial technologies matched to the scale of the spatial attributes of the subsurface problem.
Reduced Uncertainty — Through the scale–appropriateness of the data collected, HRSC more thoroughly identifies and addresses data gaps, which reduces uncertainty in the life cycle conceptual site model (CSM), thus building confidence among stakeholders. Optimization reviews commonly identify that remedy performance that does not meet expectations is related to characterization of groundwater contamination plumes and flow systems at an inappropriately large measurement scale. HRSC is focused on characterization at appropriate scales, therefore, providing a more efficient site characterization and enabling more appropriate remedy selection, design and implementation. Additionally, due to the high-density data sets that are generated during HRSC efforts, 3-D visualization and analysis is indispensable as a tool for managing data, developing and updating a life cycle CSM, identifying and assessing CSM uncertainties, performing advanced site analysis, and communicating characterization results and the basis for project decisions to stakeholders and affected communities.
Applications to All Sites — HRSC can be applied to sites of any size or regulatory program and provides stakeholders with faster and more effective site characterization and cleanup. Attributes of HRSC include obtaining the data at an appropriate scale and density, utilizing collaborative data sets, supporting the development and use of a life cycle CSM, and accounting for heterogeneity.
Best Management Practice — HRSC is a best management practice (BMP) that is consistent with, and enhances the implementation of, other environmental site characterization BMPs, such as systematic planning and life cycle CSMs, dynamic work strategies, and real-time measurement technologies. Technologies commonly associated with HRSC include real-time, direct sensing equipment and other field-based data generation technologies that provide high quantities of data which form the basis for evaluating a site in high-resolution. These data can be used by stakeholders to efficiently resolve decision questions in a dynamic characterization environment. HRSC strategies can be implemented adaptively using various sampling approaches including, but not limited to, discrete sample intervals, vertical subsurface profiling, and transect-based and media-sequenced characterization strategies.
Why Use HRSC?
The advent of innovative site characterization technologies and strategies and the development of more effective treatment methods provide new options for faster and more effective site cleanup. New approaches to site cleanup, based on the use of in situ treatment technologies, promote more targeted or “surgical” options. These targeted efforts require the best possible understanding of subsurface features, contaminant distribution, volume and mass.
HRSC strategies and technologies result in a scale-appropriate understanding of the site contaminant distribution which most efficiently and reliably supports the evaluation, selection, design and implementation of in situ treatment technologies.
Ways in which HRSC supports more effective use of in situ remedies include:
- Characterizing subsurface conditions critical to successful remedy design at a scale that conventional investigation methods are unable to attain
- Identifying the contaminant mass phase(s) that are present (for example, non-aqueous phase liquid (NAPL), dissolved, sorbed and vapor)
- Assessing whether contaminant mass is in a permeable zone (mobile porosity) or a low permeability zone (immobile porosity or essentially “storage”)
- Providing greater confidence that a site is fully characterized by increasing data density
- Enabling more accurate estimation of contaminant mass and volume through tighter source(s) identification and delineation
- Improving the cost and performance of remedy monitoring by minimizing monitoring network needs
In addition to its applicability to in situ cleanups, HRSC can be used as a targeted strategy or as an overall BMP for sites of any size and regulatory program.
How Is HRSC Conducted?
In principle, HRSC consists of making measurements on a unit volume of the subsurface that is small enough such that excessive averaging of the property being measured is avoided thus preserving detail critical to characterizing the site. HRSC requires up-front decisions regarding the appropriate measurement scale to meet this objective and the use of tools and methods appropriate for conducting the characterization. HRSC BMPs exist that accomplish scale appropriate measurements consistent with the following considerations:
- Short sample size (the vertical dimension of the sample)
- Small vertical spacing between sample locations
- Minimized horizontal spacing between borings
- Borings organized along transects oriented transverse (perpendicular) to the anticipated direction of contaminant transport
HRSC can be effectively performed using BMPs associated with the Triad Approach for conducting environmental cleanups. A general description of the Triad process associated with planning and implementing a typical HRSC effort is provided below. An example is provided to illustrate the application of HRSC concepts to a hypothetical groundwater investigation.
HRSC and the Triad Approach
Systematic planning is a fundamental Triad BMP and defines the key elements for the performance of an environmental cleanup effort. These elements include the assembly of the core technical team, identification of stakeholders, elicitation of stakeholder concerns/opinions, development of a baseline CSM and design of a preliminary dynamic work strategy (DWS).
The CSM is a functional description of what is known about a site and the contamination known or suspected to be present. In constructing and refining the CSM, available geologic, hydrogeologic and contaminant concentration data from the site are reviewed and evaluated to assess the level of data resolution necessary to address site uncertainties.
A DWS is the sequence of dynamic data collection activities implemented in the field using real-time measurement technologies to target and manage data and decision uncertainty based on the data gaps identified in the CSM. Streamlined work plans, developed in the context of a project’s regulatory framework, are used to document the DWS for HRSC efforts. Although not essential to HRSC, to maximize efficiency, the HRSC DWS should align with real-time data collection and collaborative data set BMPs associated with the Triad Approach.
Real-time measurement technologies include any data generation method that enables reliable measurement or collection and analysis of environmental media in a time frame that facilitates execution of a DWS. These measurements typically result in a much greater density of information and are available to direct field activities in time frames shorter than those commonly achieved with conventional sampling and analytical methods.
Real-time measurement technologies are used to focus when and where collaborative sampling and analyses can provide the greatest benefit. In a collaborative data set, high-density, real-time measurement screening data are supported with confirmation sampling and fixed-base laboratory analyses performed at a subset of key sampling locations. This reduces laboratory analytical costs and enables the site team to make field-decisions in real-time based on defensible analytical results supported by the weight-of-evidence of large quantities of relevant screening data. The decision logic for guiding HRSC sampling, collecting follow-up confirmatory samples and performing other sampling governed by the DWS, are documented in the investigation work plan.
Life Cycle Conceptual Site Model Development
As data gaps are closed and associated site uncertainties are reduced, the CSM plays a critical role in communicating the status of the cleanup from initial characterization through remedy implementation and, ultimately, site closure (the project life cycle). The life cycle CSM is a flexible, unified platform for maximizing the use of existing data, incorporating and evaluating HRSC sampling results and updating stakeholder understanding of site conditions. The CSM is reviewed and updated as new data are generated through each phase of the cleanup. A key tool that is often critical for effective CSM management during HRSC is 3-dimensional (3-D) visualization, which enables efficient and spatially accurate 3-D analysis of the high-density datasets typically generated by HRSC methods. For more information on the project life cycle CSM, access Environmental Cleanup Best Management Practices: Effective Use of the Project Life Cycle Conceptual Site Model (EPA 542-F-11-011).
Identification of Data Gaps
A key objective in the development and progressive refinement of the CSM is the identification and resolution of data gaps, specifically with respect to uncertainty associated with site contamination and potential site impacts to ecologic and human receptors. Therefore, all environmental media that potentially may be impacted by site contamination are considered. The HRSC approach is systematic, resulting in sequenced, scale-appropriate characterization of contaminant distribution and key migration pathways in each media. The level of detail afforded by HRSC during the project’s characterization phase minimizes the uncertainty in subsequent project phases regarding receptor identification and associated exposure point concentrations. An accurate remediation/mitigation CSM provides the basis for defining key exit strategy components including long-term remedial action objectives, remedy performance metrics and exit strategy elements.
HRSC Strategies and Technologies
The appropriate strategy for HRSC implementation is driven by the geologic media present at the site. For example, although the issues of characterization scale are similar, HRSC applied to groundwater in fractured bedrock requires a different set of tools than for groundwater in unconsolidated porous media. As discussed in more detail in the example below, a transect-based vertical groundwater profiling strategy is a common HRSC strategy for both unconsolidated and fractured consolidated media. Under a transect-based approach, HRSC profiles are advanced along transects oriented generally perpendicular to the prevailing hydraulic gradient at the site. The initial transect is constructed downgradient of the known or suspected source; the second transect is constructed through or near the known or suspected source area. If data density is adequate, spatial analysis of the resulting data typically reveals the cross-sectional morphology of groundwater contamination, including the vertical and horizontal position of high concentration plume cores and the low concentration dissolved plume. In addition, HRSC provides information regarding the relative amounts of contaminant mass present in transmissive versus nontransmissive zones, information critical to ensuring that the selected remedy is designed to be targeted appropriately. Subsequent transects are then installed downgradient of the initial transect to characterize the extent of groundwater contamination. As the plume morphology becomes better understood, profiles are performed at the projected center of high contamination to delineate the lateral extent of the plume and upgradient of the initial transect to locate and define the source area. Vertical analytical sample spacing within each profile are typically minimized to the extent practicable in accordance with project resources. Alternatively, a direct sensing tool might be used to collect vertically continuous measurements. Media sampling for collaborative analytical samples can then be appropriately targeted on zones of higher concentration, thus reducing the number of required analytical samples.
In general, characterizations of different media during a site investigation are sequenced so that the contaminant distribution data from one medium is leveraged to define optimal sampling locations in adjacent media. For example, soil gas sampling results may be used to optimize sampling locations for soil and groundwater. Similarly, groundwater data may be used to determine sampling locations for adjacent surface water and sediment.
Tools used as part of HRSC include soil gas (active or passive) sampling devices; soil coring hydrostratigraphic profiling, groundwater quality profiling and direct sensing contaminant profiling tools advanced using direct push technologies (DPT); borehole flow meters; continuous packer/liner sampling systems and media-specific sampling tools such as field test kits and field portable x-ray fluorescence (FP-XRF). HRSC in fractured bedrock is accomplished using various combinations of borehole geophysical methods, packer testing, borehole flow meters, continuous packer/liner sampling systems, and bedrock matrix sampling tools (samples from recovered bedrock core). Parker and others (2011) developed a systematic characterization process, known as the Discrete Fracture Network Approach, which incorporates these and other technologies. For further information on fractured bedrock, or on the Discrete Fracture Network Approach, see Publications or access The Discrete Fracture Network (DFN) Approach for Contaminated Bedrock Site Characterization.
The following are links to EPA websites which provide descriptions of tools which can be used to conduct HRSC:
- Superfund — Characterization and Monitoring
- CLU-IN — Technologies – Characterization and Monitoring
- BTSC — Brownfields Road Map – Investigation Technologies
To support an HRSC investigation, a demonstration of method applicability (DMA) may be warranted before deploying an innovative technology in the field. A DMA is a site-specific performance evaluation of a technology’s site-specific suitability as a field-based method. DMAs can be useful in comparing an innovative technology’s performance with more conventional laboratory-based methods and provide information on how to integrate field-generated data with analytical data collaboratively.
Data Management and Analysis
HRSC often generates large data sets which require a pre-designed strategy for effective management, analysis and communication. For field efforts using a DWS data collection approach, newly collected data are ideally processed in real-time. Following data quality assessment, the data are stored electronically and then evaluated spatially to refine the CSM and support the dynamic selection of additional sampling locations. Data must be collected at a sufficient density to ensure comprehensive analysis of data trends at the scale of resolution appropriate to address site heterogeneities (e.g., different soil types across a site). Often the most effective platform for conducting these analyses is geostatistically-based, 3-D visualization software. Practitioners and stakeholders can use these tools to visualize and analyze subsurface data (geological, hydrogeological, and chemical) in a scale-appropriate, spatially accurate format.
Example: Transect-based Groundwater Investigation Strategy
A primary HRSC strategy for groundwater contamination in unconsolidated aquifers uses transects of vertical subsurface profiles oriented perpendicular to the direction of the hydraulic gradient. Profiles are advanced to depth along each transect and used to collect detailed geologic and hydrogeologic information. These data are then combined with groundwater contaminant data obtained from discrete-interval groundwater sampling to generate 2-dimensional (2-D) cross-sections, or more advanced 3-D visualizations, to identify lower concentration dissolved plumes and higher concentration plume cores correlated with site geology and hydrogeology.
Figures 1 through 7 illustrate a hypothetical application of HRSC to investigate perchloroethene (PCE)-contaminated groundwater in an unconsolidated aquifer at a manufacturing facility. A bedrock formation that is not a drinking water concern underlies the unconsolidated aquifer at the site.
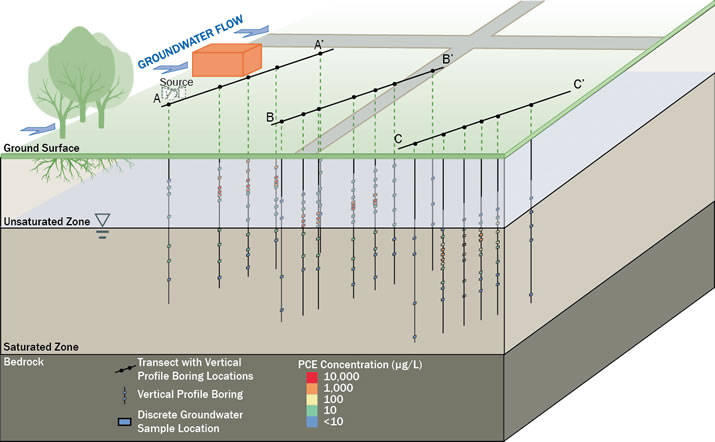
Figure 1. Investigation Transects and Vertical Profile Borings
Figure 1 shows the location of three transects used to investigate the release of PCE from a suspected source at the facility. Each transect is oriented perpendicular to groundwater flow and consists of vertical profiles advanced to depth in the overburden using direct push technology (DPT). Continuous geologic and hydrogeologic data are collected at a high density over the vertical extent of each profile boring using direct sensing technologies. In addition, a direct sensing tool such as the membrane interface probe (MIP) can be used to evaluate the distribution of contamination between higher hydraulic conductivity (K) and lower K zones. These data are used to target higher K zones for groundwater sample collection using a discrete interval groundwater sampling technology. More information on direct sensing and discrete interval sampling technologies can be found at http://www.brownfieldstsc.org/roadmap/contByInvTech.cfm.
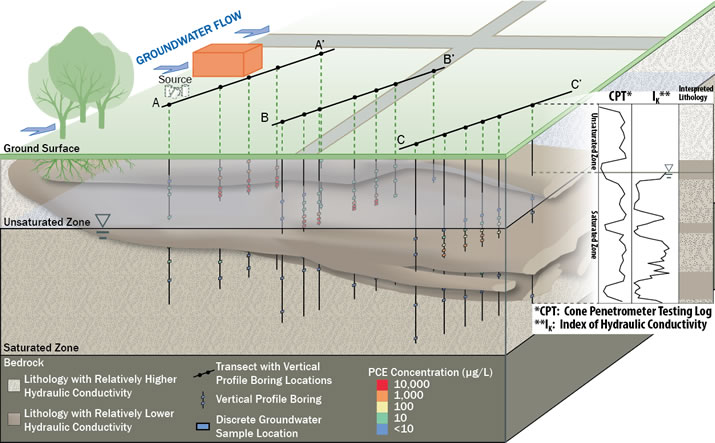
Figure 2. Site Lithology Based on Vertical Profile Boring Data
Figure 2 shows the interpreted unconsolidated and bedrock lithology at the site based on 3-D visualization of the high-density, direct sensing geologic and hydrogeologic data, and depth to bedrock information. Vertical data plots, similar to soil boring logs, show the heterogeneous distribution of lithologic zones of relatively high and low K that control contaminant fate and transport. Spatial assessment of other site data can improve site understanding. Other site data could include data from a vertical profiling effort, such as hydraulic head, physiochemical parameters, qualitative (screening) contaminant levels and quantitative contaminant concentrations.
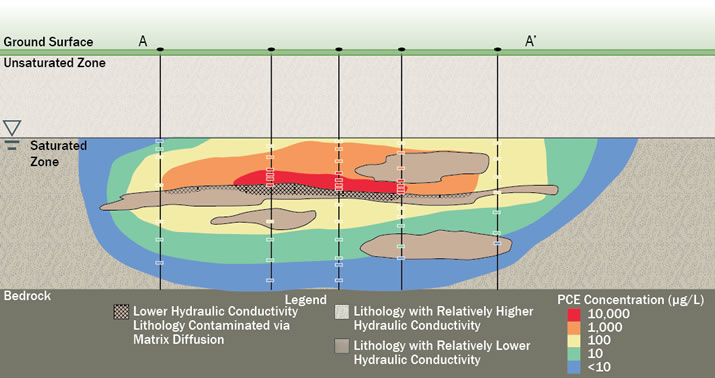
Figure 3. Transect A-A' Showing Dissolved Plume, Plume Core and Relationship to Lithology
Figure 3 is a 2-D visualization of the integrated geologic/hydrogeologic and contaminant concentration data for Transect A-A’. Contaminant concentrations detected in groundwater samples collected at discrete vertical intervals indicate a lower concentration plume and a higher concentration, higher mass per unit volume plume core (PCE concentrations exceeding 10,000 micrograms per liter [µg/L]), both in dissolved phase. [Note: on many sites, it is common for there to be multiple plume cores. This example assumes one plume core for presentation simplicity. However, the existence of multiple plume cores of various dimensions, positions and contaminant concentrations is a major driver behind the need to characterize sites using HRSC strategies.] The concentration distribution shown on Transect A-A’ is consistent with established research which concludes that 75 percent of contaminant mass discharge occurs in only five to 10 percent of the plume cross sectional area (Gilbeault et al. 2005). Concentrations markedly decline away from the plume core over relatively short distances. The plume core is confined to a relatively thin interval of relatively higher K material, indicating that the bulk of the dissolved phase mass is moving through a comparatively small cross section of the aquifer. Potentially significant contaminant mass, however, is also likely stored in the adjacent lower K units through matrix diffusion. The length of time since the contaminant release and the scale of subsurface heterogeneity significantly impact the degree to which matrix diffusion has occurred. At this stage, additional field efforts may be warranted to better characterize the degree of matrix diffusion influence to support remedy selection and design.
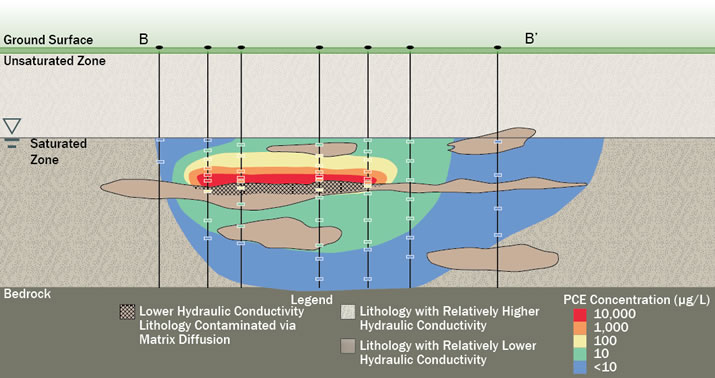
Figure 4. Transect B-B' Showing Dissolved Plume, Plume Core and Relationship to Lithology
Transect B-B’ (Figure 4), located downgradient of Transect A-A’ and at progressively greater distance from the source area, shows a consistent morphology of a thin plume core present within a larger, lower concentration dissolved plume.
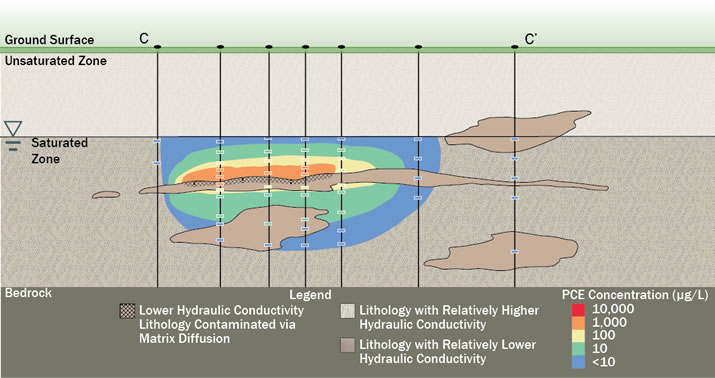
Figure 5. Transect C-C' Showing Dissolved Plume, Plume Core and Relationship to Lithology
Transect C-C’ (Figure 5), located downgradient of Transect B-B’ and at the distal edge of the plume, shows a consistent plume core and plume morphology, but with significantly lower concentrations present within the plume core.
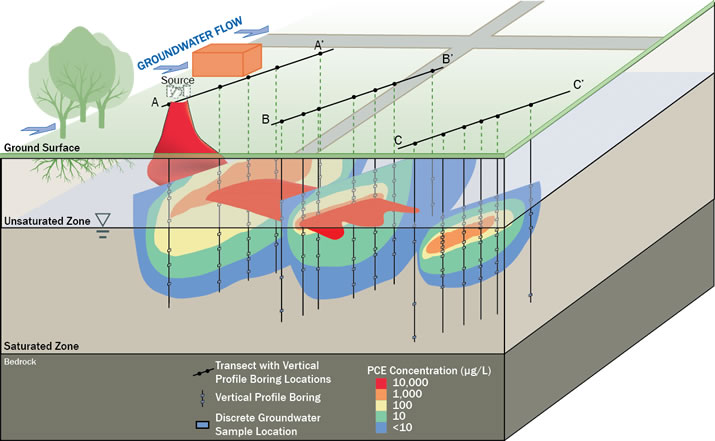
Figure 6. Plume and Plume Core Delineation
Figure 6 presents the three transects oriented in 3-D, showing the plume and plume core with respect to the source area and the prevailing groundwater flow direction. The visualization indicates that use of a HRSC strategy has effectively defined the higher K lithologic zones that serve as preferential pathways for both the dissolved plume and plume core. Similarly, HRSC has defined the lower K lithologic zones which commonly contain the majority of the contaminant mass and can serve as long-term secondary sources for the dissolved plume and plume core. The visualization also demonstrates, how in many instances, the plume information generated using HRSC transects can be used to locate or confirm specific source areas.
The subsurface detail provided by HRSC can also support the design of targeted remedial approaches to remove mass from the plume core and low K lithologic zones and control the downgradient migration of the dissolved plume at its distal edge. In this case, HRSC identifies where contaminant mass is located spatially, and clarifies the hydrogeologic context in which the mass resides and behaves. This knowledge lowers site uncertainty and can significantly contribute to the design and success of any remedy or suite of technologies being considered for site cleanup.
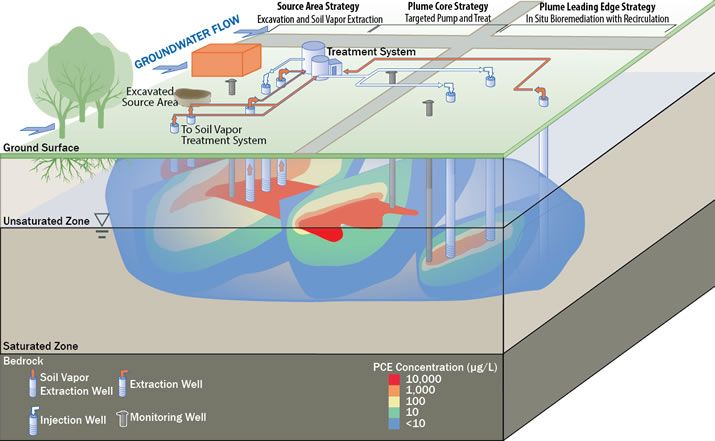
Figure 7. Targeted Remedies to Address Source Area, Plume Core and Leading Edge of Plume.
Figure 7 shows how HRSC data can be leveraged to design a comprehensive site remedial strategy and appropriately target remedial technologies. For the hypothetical site, separate technologies are implemented in an integrated strategy to address the source, plume core and plume leading edge areas. After excavation of source materials, soil vapor extraction (SVE) is used to reduce contaminant mass in source area soils and groundwater. Targeted groundwater pump and treat (P&T) is used to reduce mass in the plume core, with extraction wells designed to be screened only in the plume core rather than penetrating the full plume. This enables more efficient mass removal at lower pumping rates compared to fully penetrating wells. In situ bioremediation with recirculation is applied at the leading edge of the plume to control migration of the lower concentration dissolved plume. Monitoring wells installed at locations targeted using the HRSC data are used to monitor remedy performance, progress and compliance.
For more information on the design and implementation of HRSC groundwater investigation strategies, see: