
Green Remediation Focus
Overview
In the News
- EPA's Region 2 reported on their green remediation metrics for 2024! Please visit their posts on Facebook or X (formerly Twitter) to see how they did!
- EPA is pleased to announce two new infographics that were released on International Day of Awareness on Food Loss and Waste Reduction. The Wasted Food/Climate Change graphic depicts the climate impacts of wasted food. It was inspired by EPA's Office of Research and Development research on the impacts of food waste in the environment and shows all of the sources of greenhouse gas emissions that are embedded in the various parts of the food supply chain. The main purpose of this graphic is to show that when food is thrown away, all the emissions that are used to create the food are thrown away, as well. The Compost/Climate Change graphic conveys how composting food scraps reduces emissions and can help adapt to climate change. There are four text boxes on the right side of the graphic that outline the benefits of both creating compost and applying compost. Both graphics are available on the EPA Sustainable Management of Food Graphics page.
- The Association of Environmental and Engineering Geologists (AEG) 67th Annual Meeting held September 2024 in Philadelphia, PA, included and Environmental Site Characterization Symposium, which featured a session on Green, Sustainable, and Resilient Remediation. For additional information, please contact AEG Environmental Characterization and Remediation Working Group.
- Integrating green remediation and climate resilience work in Superfund service contracts
- EPA releases fact sheet about considering climate change at contaminated groundwater sites » News archives...
Upcoming Events
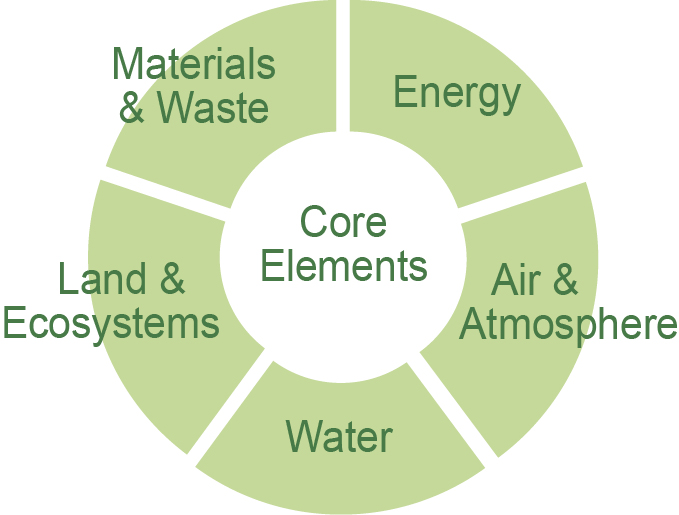
Learn about the core elements for green remediation strategies that inform cleanups in each of these areas by clicking on them.
Please visit the calendar page to view all the upcoming events.
State-of-the-art technologies, novel field methods, and "tried and true" design and engineering techniques can be combined to address the core elements of green remediation. Best management practices are in place under a range of cleanup programs including Superfund, RCRA, federal facility, brownfield, and state voluntary actions. Explore details about the site-specific profiles available below.
- An Overview
 (2 pp, 525K)
 - Bioremediation (4pp, 493K)
- Clean Fuel & Emission Technologies for Site Cleanup (5 pp, 425K)
- Excavation and Surface Restoration (5pp, 286K)
- Implementing In Situ Thermal Technologies (6pp, 249K)
- Integrating Renewable Energy (6 pp, 840K)
- Materials and Waste Management (4pp, 397K)
- Mining Sites (6pp, 535K)
- PCB Cleanups (8pp, 760K)
- Pump and Treat Systems (6pp, 667K)
- Sites with Leaking Underground Storage Tanks (4pp, 216K)
- Site Investigation and Environmental Monitoring (4pp, 179K)
- Soil Vapor Extraction & Other Air-Driven Systems (4pp, 457K)
- Waste Cover Systems and Integrated Site Reuse Planning (5 pp, 641K)
Learn about footprint assessment tools and view comprehensive reports on footprint evaluations conducted at sites undergoing cleanup. EPA's universal greener cleanup metrics provide a uniform and transparent approach to quantifying the environmental footprint associated with materials, wastes, water or energy that are used or generated during a cleanup. EPA's Spreadsheets for Environmental Footprint Analysis (SEFA) tool is available to help evaluate the environmental footprint of a cleanup project at a detailed level.
Resources
GR Technology Primer![]() (56pp, 814K)
(56pp, 814K)
Incorporating Sustainable Environmental Practices into Remediation of Contaminated Sites.
Community Guide to Greener Cleanups![]() (2pp, 1.4MB)
(2pp, 1.4MB)
Incorporating Sustainable Environmental Practices into Remediation of Contaminated Sites.