Laser-Induced Fluorescence
- Direct-Push Technologies
- Explosives
- Fiber Optic Chemical Sensors
- Gas Chromatography
- Geophysical Methods
- High-Resolution Site Characterization (HRSC)
- Immunoassay
- Infrared Spectroscopy
- Laser-Induced Fluorescence
- Mass Flux
- Mass Spectrometry
- Open Path Technologies
- Passive (no purge) Samplers for Groundwater
- Test Kits
- X-Ray Fluorescence
Description
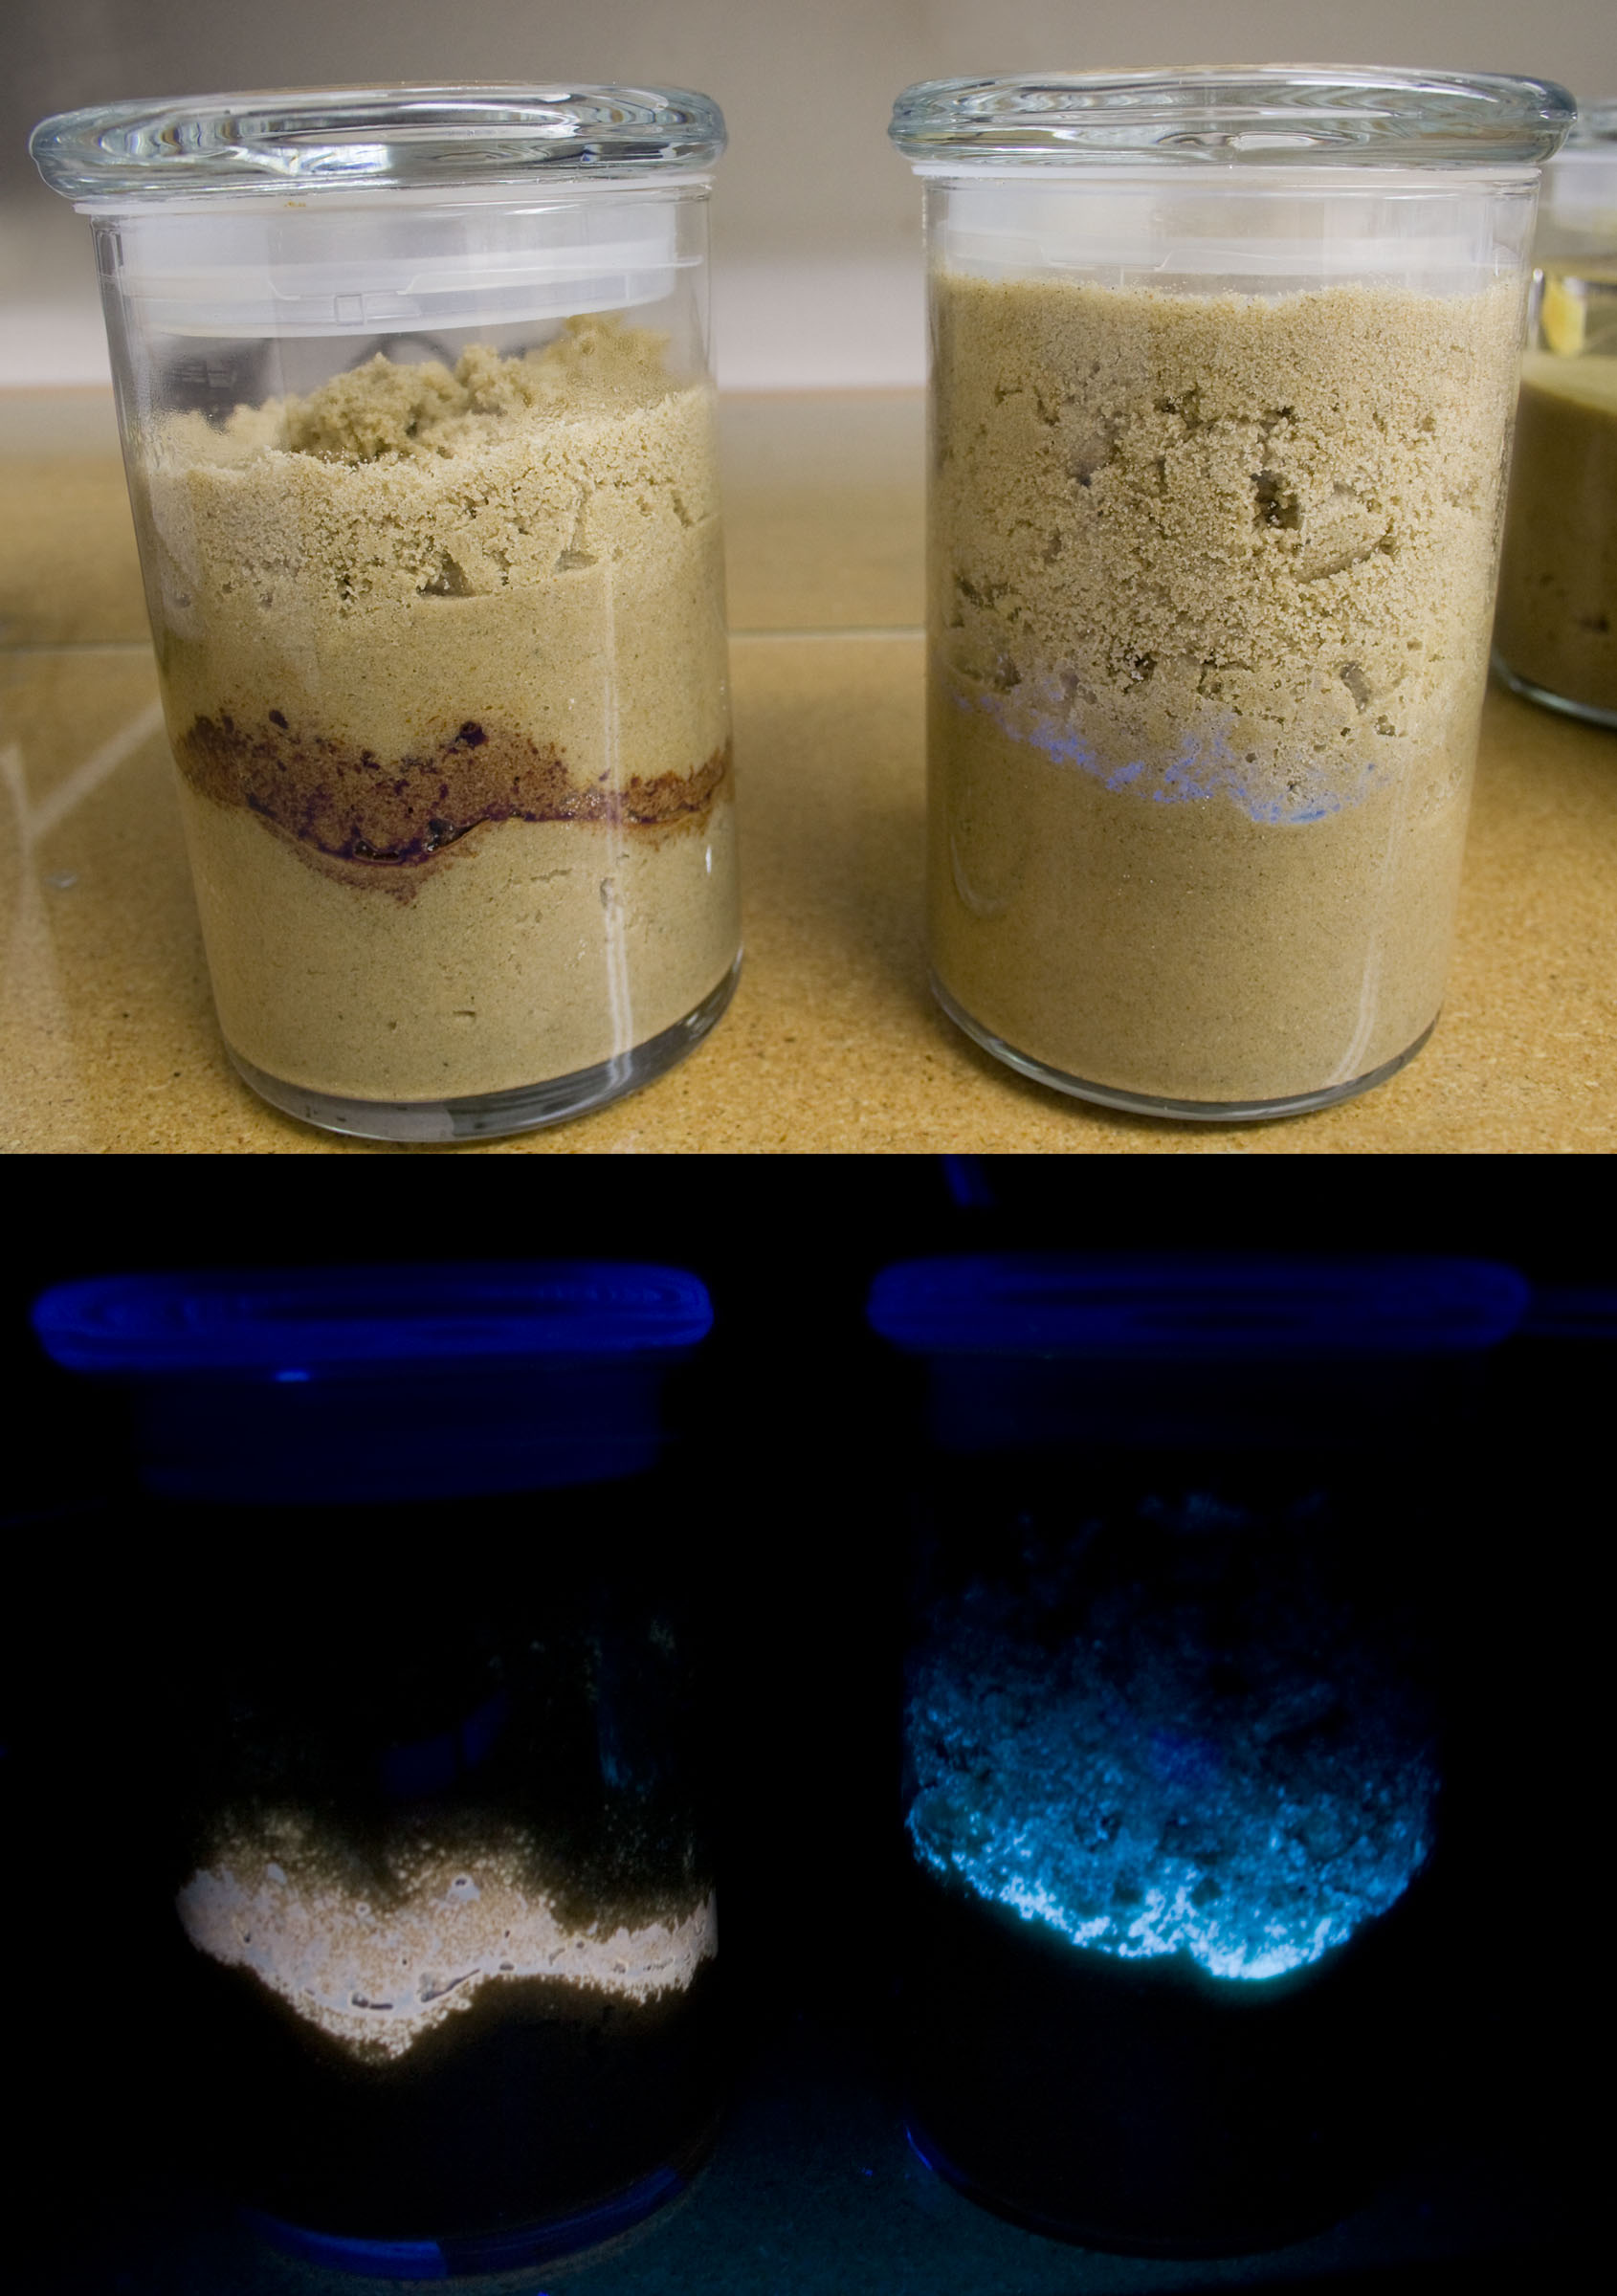 Laser-induced fluorescence (LIF) is a method for real-time, in situ field screening of residual and non-aqueous phase organic contaminants in undisturbed vadose, capillary fringe, and saturated subsurface soils and groundwater. The technology is intended to provide highly detailed, qualitative to semiquantitative information about the distribution of subsurface contamination that fluoresces, such as petroleum products containing polycyclic aromatic hydrocarbons (PAHs). An ultraviolet light-emitting diode (UV LED) included in this discussion can also detect monoaromatics (MAHs). Hydrophobic dyes that exhibit fluorescent characteristics can be injected into the subsurface ahead of the LIF probe window. These dyes partition into NAPL sources and emit a characteristic fluorescent pattern that is different from the unpartitioned dye, thus allowing for the detection of NAPL bodies.
LIF sensors can be deployed on cone penetrometer (CPT) or percussion direct-push rigs. Note that if deployed on a CPT, soil behavior-type data will also be collected, which can aid in the interpretation of site stratigraphy. Currently available LIF equipment is not designed to detect dissolved-phase contaminants.
Theory of Operation
Fuels, oils, creosotes, and coal tars are composed of various amounts of MAHs, PAHs, and aliphatic hydrocarbons. Electrons in the aromatic molecules will absorb light energy at a given wavelength and re-emit it in the form of fluorescence at a lower energy level. The spectra created by these emitting molecules are unique to each. Fuels, oils, creosotes, and coal tars are mixtures and create overlapping spectra, so it is not possible to identify individual species with in situ LIF technology; however, it is possible to determine relative concentrations and usually the type of product present. The probe generally is pushed or driven at a constant rate and provides continuous readings with a vertical spatial resolution of 2-3 cm. Only the relative fraction of analyte that is optically accessible at the window of the probe can contribute to the fluorescence signal. LIF sensitivity to petroleum hydrocarbons on soil has been shown to be inversely proportional to the available surface area of the soil substrate. Sandy soils tend to have a much lower total available surface area than clay soils. A specific concentration of petroleum hydrocarbon compounds in sandy soils generally yields a correspondingly higher fluorescence response than an equivalent concentration in clay-rich soils (Bujewski and Rutherford 1997).
Chlorinated organics such as trichloroethene and tetrachloroethene are found at many contaminated sites across the country. They do not fluoresce; however, fluorescent dyes can be made to partition into them, with a return signal related to the size of the chlorinated mass. The advancement speed of a dye-equipped LIF probe is generally slower than that for hydrocarbon detection. The slower speed provides for a smaller spatial resolution of 0.5 cm and enables detection of small contaminant ganglia.
Five of the six currently commercially available UV fluorescent systems use a technology developed wholly or in part by Dakota Technologies. They differ primarily in the laser used to excite the PAHs and in whether they can be used only on a CPT or can also be driven by percussion rigs. The captured fluorescent light of each PAH mixture presents a distinctive wavelength/time matrix (WTM). The WTM, however, cannot be produced while the probe is moving. By sampling the total fluorescence at different wavelength channels and optically delaying the fluorescence pulses to photomultiplier tubes that are recorded with an oscilloscope, a multi-wavelength waveform is created. The waveform allows the simultaneous observation of the spectral and temporal qualities of the fluorescence with depth and can be used to identify different products.
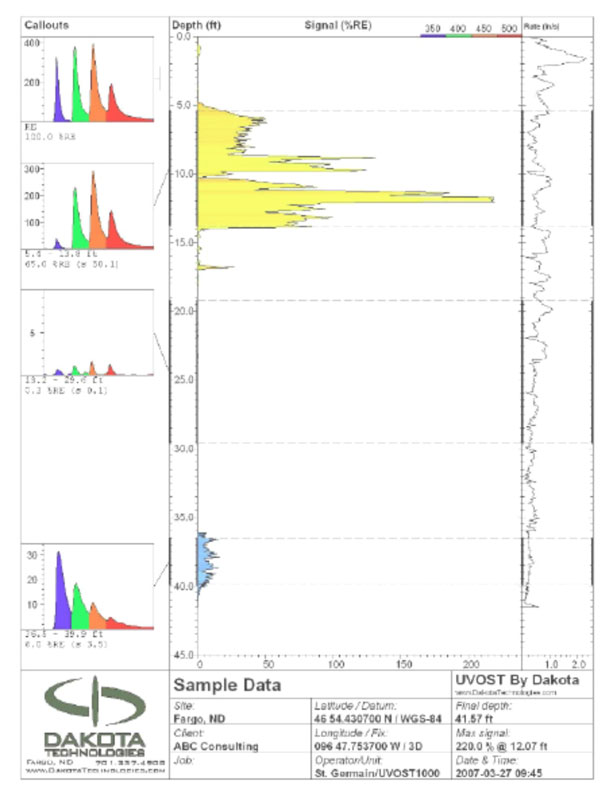
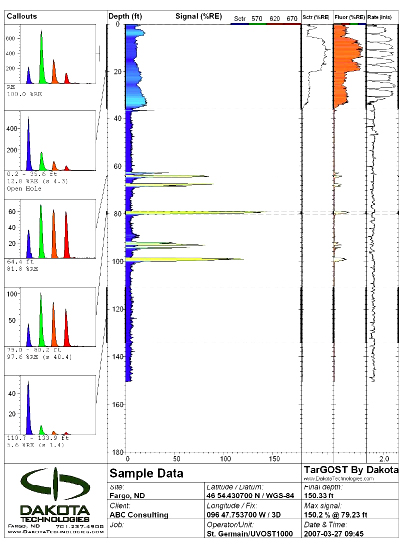
The waveform data are further reduced to a color-coded chart that is displayed as a percent of the response of the calibration reference emitter (RE). The RE, similar to a calibration gas used in a flame ionization or photoionization detector, is placed on the sapphire probe window before each push.
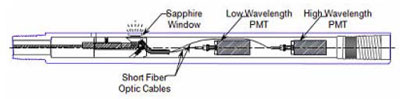
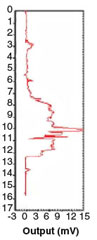
The fifth available system is the Fuel Fluorescence Detector, which uses an LED rather than a laser to generate UV light at 254 nm (an older design utilized a mercury vapor lamp). The LED is mounted in a housing opposite a sapphire window located above the CPT cone and sleeve strain gauges. Fluorescent light from MAHs and PAHs is captured downhole by two photomultiplier tubes. One tube captures lower energy wavelengths and the other captures higher energy wavelengths. The response is relayed to the surface and plotted on a graph as depth versus output in millivolts. The dual photomultipliers allow qualitative differentiation between light and heavy fuels.
References
![]() New Generation Optical Sensors for Characterizing NAPL Source Zones
New Generation Optical Sensors for Characterizing NAPL Source Zones
St. Germain, R. Remediation Technology Symposium.
May 14-16, 2008, 34 slides.
![]() The Rapid Optical Screening Tool (ROST™) Laser-Induced Fluorescence (LIF) System for Screening of
The Rapid Optical Screening Tool (ROST™) Laser-Induced Fluorescence (LIF) System for Screening of
Petroleum Hydrocarbons in Subsurface Soils Innovative Technology Verification Report
Bujewski, G. and B. Rutherford.
EPA 600-R-97-020, 104 pp, 1997.
![]() Dye Based Laser-Induced Fluorescence Sensing of Chlorinated Solvent DNAPLs
Dye Based Laser-Induced Fluorescence Sensing of Chlorinated Solvent DNAPLs
St. Germain, R., M. Einarson, A. Fure, S. Chapman, and B. Parker.
3rd International Symposium on Cone Penetration Testing, May 12-14, 2014, Las Vegas, Nevada
Equipment
Five laser-based induced-fluorescence systems and one light-emitting diode system are currently available:
- Rapid Optical Screening Tool (ROST®) System
The ROST™ system uses a dye laser mounted in a CPT rig. It is licensed to Fugro Geosciences.
Description
The ROST™ detects the presence and quantitates the amount of PAHs in the subsurface by laser-induced fluorescence. The ROST® is a tunable dye LIF system designed as a field screening tool for detecting petroleum hydrocarbons in the subsurface. The ROST® LIF system uses a pulsed laser coupled with an optical detector to make fluorescence measurements via optical fibers.
The measurement is made through a sapphire window on a probe that is pushed into the ground with a truck-mounted cone penetrometer. The ROST® approach permits temporary or permanent installation of the LIF equipment on a CPT truck. The CPT LIF system uses a steel probe containing the LIF sapphire optical window as well as the cone and sleeve strain gauges. The excitation and emission optical fibers are isolated from the soil system by a 6.35-mm diameter sapphire window located 60 cm from the probe tip and mounted flush with the outside of the probe.
The ROST® LIF system uses 600-µm diameter fibers that are up to 100 m in length. The laser system used in the ROST® is capable of generating wavelengths of light ranging from about 280 nm to about 300 nm, depending on the dye used. The wavelength of light produced by the ROST™ LIF laser is tunable within this range. The most commonly used wavelength is 290 nm. The laser system couples to a silica-clad UV/visible light-transmitting optical fiber. This fiber and the collection fiber are integrated with the geotechnical probe and umbilical of a standard truck-mounted CPT system.
Because the probe is mounted with CPT cone and sleeve strain gauges, the LIF push will also generate soil behavior type data that can be used for geological interpretation. Actual soil samples are needed to correlate CPT soil behavior data to site soil types.
Target Analytes
ROST® LIFs can detect most fuels and oils. They generally do poorly with heavier hydrocarbon mixtures such as coal tars, creosote (unless cut with diesel), and bunker C. They do not detect monoaromatics, polychlorinated biphenyls, chlorinated alkenes and alkanes, or explosives.
Calibration
The ROST® system is calibrated using an RE.
Cost Data
The estimated cost of sampling using the ROST®/CPT LIF system is $5,000 per day (April 2011), which does not include mobilization and per diem. Under normal conditions, 200 to 300 cumulative feet of pushes can be advanced per day.
References
 Innovations in Site Characterization: Streamlining Cleanup at Vapor Intrusion and Product Removal Sites Using
the Triad Approach: Hartford Plume Site, Hartford, Illinois
Innovations in Site Characterization: Streamlining Cleanup at Vapor Intrusion and Product Removal Sites Using
the Triad Approach: Hartford Plume Site, Hartford, Illinois
EPA 542-R-10-006, 143 pp, 2010.The Rapid Optical Screening Tool (ROST®) Laser-Induced Fluorescence (LIF) System for Screening of
Petroleum Hydrocarbons in Subsurface Soils Innovative Technology Verification Report
Bujewski, G. and B. Rutherford. EPA 600-R-97-020, 104 pp, 1997. - Site Characterization and Analysis Penetrometer System (SCAPS) LIF Sensor and Support System
 The Site Characterization and Analysis Penetrometer System (SCAPS) was one of the first systems to deploy a LIF probe. It is owned and operated by the U.S. Navy, Army Corps of Engineers, and Department of Energy.
Description
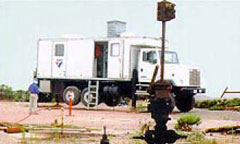
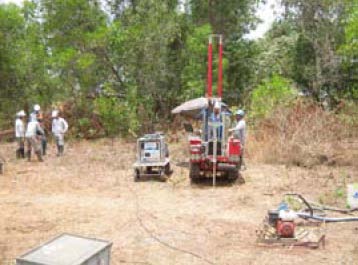
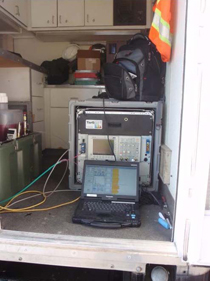
The forward portion of the truck-mounted laboratory is the push room. It contains the rods, hydraulic rams, and associated system controllers. The weight of the CPT truck provides a 20-ton static reaction force for advancing the probe rod into the ground, which allows the hydraulics to advance threaded-end steel rod into the ground at about 1 meter per minute. The rods, sensing probes, and sampling tools can be advanced to 50 meters or more in soil. As the rods are withdrawn, grout can be injected through probe rods to seal the push hole. The trucks are also fitted with a self-contained decontamination system that allows the rods and probe to be steam cleaned as they are withdrawn from the push hole, through the steam cleaning manifold, and back into the CPT push room.
The rear portion of the truck contains the laboratory in which components of the LIF system and onboard computers are located.
The CPT LIF systems use a steel probe containing the LIF sapphire optical window and cone and sleeve strain gauges. The excitation and emission optical fibers are isolated from the soil system by a 6.35-mm diameter sapphire window located 60 cm from the probe tip and mounted flush with the outside of the probe. The SCAPS LIF fibers are 500 µm in diameter and up to 100 m in length.
The SCAPS LIF pulsed laser fiber optic-based system uses 337-nm UV light from a pulsed nitrogen laser. The nitrogen laser is coupled to a silica-clad UV/visible light transmitting optical fiber. This fiber and the collection fiber are integrated with the geotechnical probe and umbilical of a standard truck-mounted CPT system. As the pulse from the laser enters the excitation fiber, a photodiode is triggered that synchronizes the activation of the photodiode array (PDA) detector with the light returning from downhole soil. Fluorescence stimulated in the in situ soil "sample" by the laser is collected by the emission fiber and returned to a spectrograph, where it is dispersed spectrally on the PDA for analysis.
This arrangement allows rapid acquisition of spectral data. An entire fluorescence emission spectrum measurement, composed of the average of responses from 20 laser firings, can be collected in approximately 1 second if the laser is firing at 20 Hz (20 per second). At a pushing rate of about 1 m/min, this process yields a measurement with a vertical useable spatial resolution of roughly 2 cm. A host computer equipped with custom software controls the fiber optic fluorometer sensor system and stores fluorescence emission spectra and conventional CPT sleeve friction and tip resistance data. The host computer is also used to generate real-time depth plots of fluorescent intensity at the spectral peak, wavelength of spectral peak, sleeve friction and tip resistance, and soil type characteristics as interpreted from the strain gauge data. The fluorescent intensity in the spectral window is plotted as a function of depth in real time as the probe is pushed into the soil.
If desired, the SCAPS rigs can also be equipped with UVOST® and TarGOST® systems. These systems are described in following sections.
Target Analytes
SCAPS LIFs can detect most fuels and oils. They generally do poorly with heavier hydrocarbon mixtures such as coal tars, creosote (unless cut with diesel), and bunker C. They do not detect monoaromatics, polychlorinated biphenyls, chlorinated alkenes and alkanes, or explosives.
Calibration
The SCAPS LIF sensor is calibrated using spiked soil samples representative of the site. Diesel fuel marine standard or other petroleum hydrocarbons with a fluorescence response appropriate for the site are used to spike the soil samples. The calibration standards are run in triplicate at the beginning of each day and again if equipment is changed.
Cost Data
The estimated cost of sampling using the SCAPS LIF system is $5,000 per day (April 2011), which does not include mobilization and per diem. Under normal conditions, 200 to 300 feet of pushes can be advanced per day.
References
McCormick and Baxter Superfund Site Case Study: Stockton, California
U.S. EPA, 104 pp, [ca. 2002].Site Characterization Analysis Penetrometer System (SCAPS) Innovative Technology
Evaluation Report
EPA 540-R-95-520, 68 pp, 1995.The Site Characterization and Analysis Penetrometer System (SCAPS) Laser-Induced
Fluorescence (LIF) Sensor and Support System Innovative Technology Verification Report
Bujewski, G. and B. Rutherford.
U.S. EPA, 96 pp, 1996.Site Characterization Analysis Penetrometer System with Laser-Induced Fluorometry (SCAPS-LIF)
California Environmental Protection Agency, Department of Toxic Substances Control, Certification Program, 1996.The Tri-Service Site Characterization and Analysis Penetrometer System—SCAPS:
Innovative Environmental Technology from Concept to Commercialization
Adams, J.W. and G. Robitaille.
U.S. Army Environmental Center, SFIM-AEC-ET-TR-99073, 48 pp, 2000. - Tar-Specific Green Optical Screening Tool (TarGOST®)
Courtesy Dakota Technologies
TarGOST® was designed specifically for detecting coal tars, creosotes, and other heavy oils. It is a Dakota Technologies tool that can be used with CPT or percussion-driven equipment.
Description
Because coal tars, creosotes, and other heavy oils are composed of both light and heavy PAHs, high-energy light tends to be absorbed by the light PAHs, which in turn transfer the energy to the heavy PAHs. This energy transfer leads to weak or no fluorescence.
The TarGOST® system uses an Nd:YAG laser emitting at a green visible light frequency of 532 nm. Visible light is not absorbed by the light PAHs but is readily absorbed by the heavy ones. As they return to their lower energy state, they will emit a moderate level of red-shifted fluorescence.
Courtesy Dakota Technologies
The light is transmitted via fiber optics to a sapphire optical window that illuminates the adjacent soil. Both reflected transmission light (scatter) and any fluorescence is reflected by mirror and sent to a spectrometer at the surface. The TarGOST® measures wavelengths at 532, 570, 620, and 670 nm. St. Germain and Peterson (2006) describe this process as follows: "The spectrometer in the TarGOST® system disperses the collected light into a 'rainbow' across the back plane of the spectrometer. A long-pass cutoff filter in the entrance of the spectrometer blocks the majority of the relatively intense laser light being scattered into the detector from the soil in front of the downhole window. Four fiber optic fibers are located in the backplane of the spectrometer. One fiber collects a small portion of the scattered laser light (very intense relative to fluorescence), while the other three fibers capture any fluorescence due to coal tar presence or other fluorophores.
The four fibers differ in length (2, 12, 22, 32 meters), and each delivers its collected light to a photomultiplier tube (PMT) at a fixed delayed time interval (~50 ns). The result of this is a 'train' of time-delayed photon packets all arriving at the same PMT. The PMT converts this 'train' of light into a current pulse that is monitored by a fast digital storage oscilloscope. The signal generated is called a waveform. The laser light is observed in the first channel (left-most) and the three fluorescence pulses are observed in the following three channels."The waveform response areas are calculated and presented as a percent of RE value. These values are displayed in graphical form as a function of depth or fluorescence versus depth log.
Target Analytes
TarGOST® detects manufactured gas plant coal tars, creosotes, pentachlorophenols, and bunker C. It performs poorly in detecting fuels and oils that contain predominately small PAHs. It does not detect monoaromatics, polychlorinated biphenyls, chlorinated alkenes and alkanes, or explosives.
Calibration
The TarGOST® system is calibrated using an RE.
Cost Data
The typical cost per day for the TarGOST® and push platform is $4,000 (April 2011).
References
Case Study: Confirmation of TarGOST® Laser Induced Fluorescence DNAPL Delineation with Soil Boring Data
Okin, M.B., S.M. Carroll, W.R. Fisher, and R.W. St. Germain.
Proceedings of the International Symposium and Exhibition on the Redevelopment of Manufactured
Gas Plant Sites, 4-6 April 2006, Reading, UK.Development of a Characterization and Assessment Framework for Coal Tar at MGP Sites: Coal Tar
Management Frameworks
Electric Power Research Institute (EPRI), Palo Alto, CA. 104 pp, 2006.An Investigation into Subsurface Sampling and Characterization Efficiency Using a High Resolution
GIS-Based Three-Dimensional Earth System
Knudsen, D.J. and B. Saini-Eidukat.
North Dakota Water Resources Research Institute, 20 pp, 2008. - Ultraviolet Light Emitting Diode (UV LED)
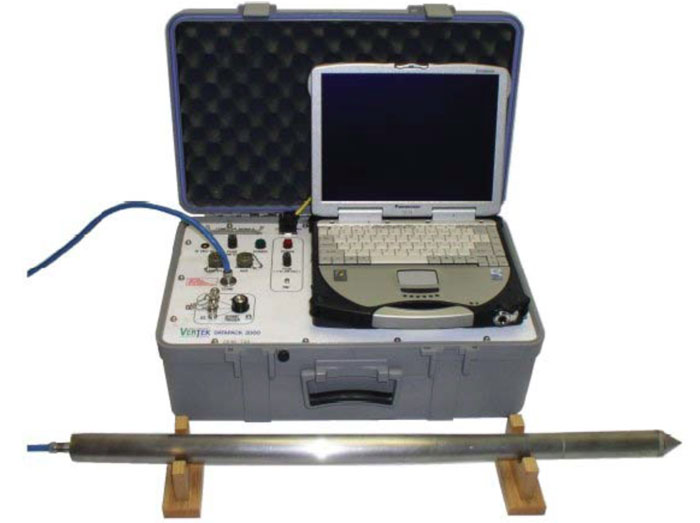
The UV LED system made by Vertek Manufacturing replaces their older system, which utilized a mercury vapor lamp as an energy source.
Description
Courtesy Vertek Manufacturing a Division of ARA
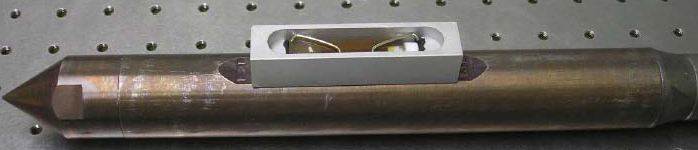
The system uses a metal housing with a sapphire optical window that is mounted above the cone and sleeve strain gauges of a CPT rig. Within this housing are an LED and two photomultipliers. The LED emits a 254-nm UV light through the sapphire window as it is advanced at 2 cm/sec. This light is both absorbed and reflected back through the window. The light absorbed by the MAHs and PAHs is re-emitted at a lower energy by these hydrocarbons. The re-emitted light falls on the two photomultipliers, which turn its intensity into an electrical current that is logged at the surface as output in millivolts versus depth. The higher the current, the more contaminated the subsurface.
Courtesy Vertek a Division of ARA
The photomultipliers are set to collect two different ranges of fluorescence emissions. One is sensitive to 280-450 nm wavelengths, and the other is sensitive to 475+ nm wavelengths. By collecting these energy ranges, a comparison can be made between intensities that potentially will allow differentiation between lighter and heavier fuels. The high-energy emission light will excite MAHs as well as PAHs; however, it is likely to be quenched in materials rich in heavy PAHs, such as coal tars.
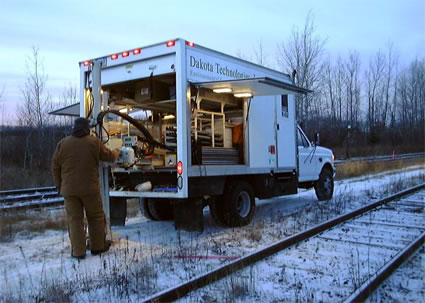
The system can be deployed on both CPT and direct push rigs.
Target Analytes
The UV LED is most successful at detecting jet fuel, diesel, gasoline, monoaromatic releases (benzene, toluene, ethylbenzene, and xylenes), and home heating and motor oil. It is unlikely to detect coal tars, creosotes, pentachlorophenols, or bunker C. It does not detect polychlorinated biphenyls, chlorinated alkenes and alkanes, or explosives. Detection limits are in the 100 to 500 ppm range, depending upon soil and petroleum type.
Calibration
The UV LED is calibrated using a dark and light card to ensure its output falls within an acceptable range.
Cost Data
The typical cost per day of the equipment and rig is $2,800 (April 2011).
References
Floater/Sinker Site Assessment Complicated by Asbestos
Merritt, C.A.
Proceedings of the Annual International Conference on Soils, Sediments, Water and Energy,
Vol. 15, No. 1, 351-359, 2010.Use of Multiple Induced Fluorescence Tools at a Pipeline Site to Characterize Residual LNAPL
Patton, K.R. and S.M. Kuhlman.
2nd International Symposium on Cone Penetration Testing, May 9-11, 2010. - UltraViolet Optical Screening Tool (UVOST®)
Courtesy Dakota Technologies
The UVOST® system is designed specifically for detecting light to mid-weight fuels and oils containing 2- to 4-ring PAHs (St. Germain and Peterson 2006). It can be deployed on CPT or direct-push rigs and is available from a number of vendors.
Description
The UVOST® system uses an XeCl excimer laser to generate very fast pulses of 308 nm UV light at 50 Hz. The light is transmitted via fiber optics to a sapphire optical window that illuminates the adjacent soil. Both reflected transmission light (scatter) and any fluorescence is reflected by mirror and sent to a monochromator at the surface. A cutoff long-pass filter is placed at the front of the monochromator to reject the vast majority of emission laser light but pass the lower energy (longer wavelength) fluorescence (Lieberman 2007).
The fluorescent light is dispersed by the monochromator so that it can be sampled using fiber optic cables at four wavelengths (350, 400, 450, and 500 nm). To achieve separation of the four channels, the photons must be time delayed so that they strike the detector at different times. To accomplish this, each fiber optic is made 10 m longer than the next, i.e., the fibers are 2, 12, 22, and 32 m long for the 350, 400, 450, and 500 nm wavelengths, successively, delaying each channel by approximately 50 ns. The wavelength intensity is converted by a photomultiplier tube into an electrical current pulse that is measured by a high-speed oscilloscope, which produces a waveform. The waveform represents a unique measurement of both the spectral and temporal components of the fluorescence.
The waveform response areas are calculated and presented as a percent of the RE value. These values are displayed in graphical form as a function of depth or fluorescence versus depth log.
Target Analytes
UVOST® readily detects gasoline (highly weathered and/or aviation gas yield is very low to zero), diesel, jet (kerosene), motor oils, cutting fluids, hydraulic fluid, light crude oils, and fuel oils. Because of self-quenching/intersystem crossing/photon cycling, UVOST® will rarely detect creosote/pentachlorophenol, coal tars, and bunker fuel. It does not detect monoaromatics, polychlorinated biphenyls, chlorinated alkenes and alkanes, or explosives.
Calibration
The UVOST® system is calibrated using an RE.
Cost
The typical cost per day for the UVOST® with CPT pushing platform is $4,000 (April 2011). The cost may be lower if the platform is a percussion drive device.
References
Detailed Investigation of the Minnesota Slip Featuring Laser Induced Fluorescence
Streitz, A. and S. Johnson.
Minnesota Pollution Control Agency, 56 pp, 2005.Direct Push Chemical Sensors for DNAPL
Lieberman, S.H.
Environmental Security Technology Certification Program, 170 pp, 2007.An In Situ Laser-Induced Fluorescence System For Polycylic Aromatic
Hydrocarbon-Contaminated Sediments
Aldstadt, J., R. St. Germain, T. Grundl, and R. Schweitzer.
U.S. EPA, Great Lakes National Program Office, 54 pp, 2002.New Generation Optical Sensors for Characterizing NAPL Source Zones
St. Germain, R.
Remediation Technology Symposium, May 14-15, 2008, Sacramento, CA, 34 slides, 2008.Use of Multiple Induced Fluorescence Tools at a Pipeline Site to Characterize Residual LNAPL
Patton, K.R. and S.M. Kuhlman.
2nd International Symposium on Cone Penetration Testing May 9-11, 2010. - Dye-Enhanced Laser Induced Fluorescence System (DyeLIF™)
Courtesy Dakota Technologies
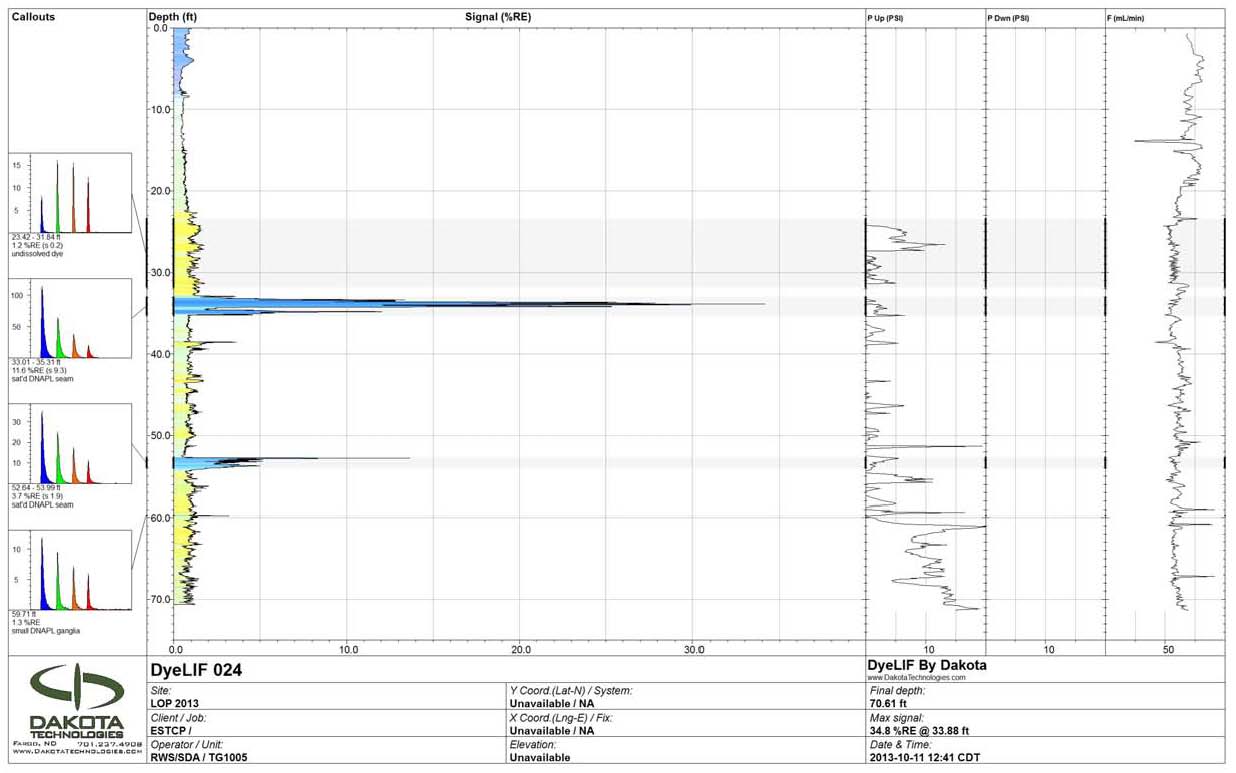
DyeLIF™ (Dakota Technologies) was designed specifically for detecting chlorinated solvent DNAPL. This tool that can be used with CPT or percussion-driven equipment.
Description
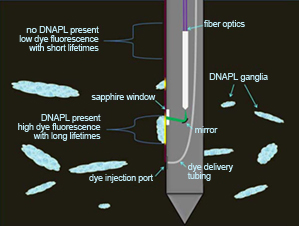
Because chlorinated solvents do not generally contain components that fluoresce, the DyeLIF™ system introduces an aqueous delivery fluid containing a hydrophobic dye through a small injection port that is situated 22 cm below the LIF window. When DNAPL is present, the dye will partition into it in less than one second. The fluorescent response of the solvated dye is much more intense and is distinct from that of the unsolvated dye. The response is monotonic; more fluorescence equates to higher pore saturation of DNAPL.
Courtesy Dakota Technologies
A pulsed laser is used to excite the dye. The light is transmitted via fiber optics to a sapphire optical window that illuminates the adjacent soil. Both reflected laser light (scatter) and any fluorescence is reflected by a mirror and sent to a spectrometer at the surface. A filter in the entrance of the instrument blocks the majority of the relatively intense laser light being scattered into the detector from the soil in front of the downhole window. Four fiber optic fibers inside the instrument are used to delay four wavelengths of fluorescence by ~50 ns with respect to each other, before delivering them to the detector, resulting in a multi-wavelength waveform data form.
The waveform response areas are calculated and presented as a percent of RE value. These values are displayed in graphical form as a function of depth or fluorescence versus depth log.
Target Analytes
DyeLIF™ detects common chlorinated solvent NAPLs, such as trichloroethene and tetrachloroethene.
Calibration
The DyeLIF™ system is calibrated using a proprietary reference emitter (RE).
Cost
The typical cost per day for the DyeLIF™ system is $3,360 (January 2015). This includes the operator but does not include the cost of the push platform, which generally is around $1,500 per day for DP.
References
Dye Based Laser-Induced Fluorescence Sensing of Chlorinated Solvent DNAPLs
St. Germain, R., M. Einarson, A. Fure, S. Chapman, and B. Parker.
3rd International Symposium on Cone Penetration Testing, May 12-14, 2014, Las Vegas, Nevada.Field Testing of the DyeLIF™ High Resolution Chlorinated DNAPL Logging System
St. Germain, R., M. Einarson, A. Fure, S. Chapman, and B. Parker.
Ninth International Conference on the Remediation of Chlorinated and Recalcitrant Compounds, May 19-22, 2014, Monterey CA.
Advantages/Limitations
LIF instruments provide a relatively fast method for profiling the presence of compounds containing aromatic hydrocarbons in the subsurface. They are especially good at showing the relative concentrations of these compounds with depth so that cleanup activities can be better focused. These technologies do not provide specific contaminant concentrations and cannot be used in subsurfaces that are not amenable to direct push technologies. The instruments do have different compound detection capabilities, and it is important for the user to pick the instrument best suited for the aromatic composition of the target compound. The advantages and limitations of the various technologies are given in the table below.
| ROST™ | SCAPS | TarGOST® | UV LED | UVOST® | DyeLIF™ | |
|---|---|---|---|---|---|---|
| Advantages | ||||||
| Abandonment | The sample holes can be grouted as the push rod is pulled from the hole. | The sample holes can be grouted as the push rod is pulled from the hole. | If a CPT is used, the sample holes can be grouted as the push rod is pulled from the hole. | |||
| Accessibility | When mounted on a direct push (DP) platform (non-CPT) can access tight areas and operate inside buildings. | When mounted on a direct push (DP) platform (non-CPT) can access tight areas and operate inside buildings. | When mounted on a direct push (DP) platform (non-CPT) can access tight areas and operate inside buildings. | When mounted on a direct push (DP) platform (non-CPT) can access tight areas and operate inside buildings. | ||
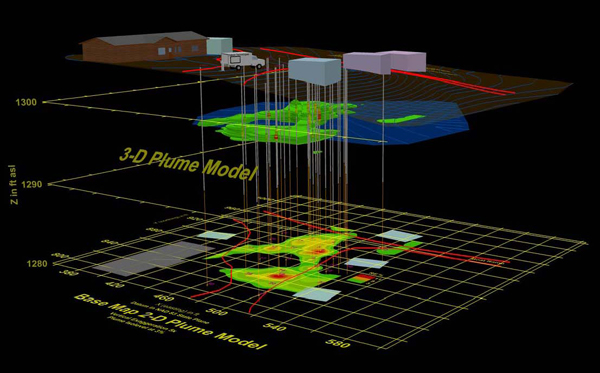
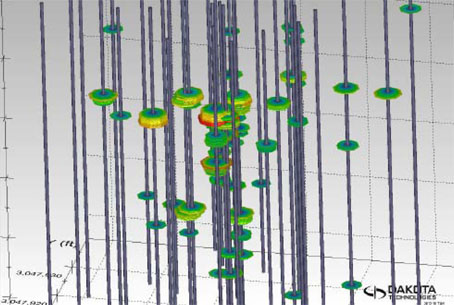
| 3-D Data | Data are compatible with 3-D visualization software, which can be used to refine the site conceptual model. | Data are compatible with 3-D visualization software, which can be used to refine the site conceptual model. | Data are compatible with 3-D visualization software, which can be used to refine the site conceptual model. | Data are not compatible with 3-D visualization software. | Data are compatible with 3-D visualization software, which can be used to refine the site conceptual model. | Data are compatible with 3-D visualization software, which can be used to refine the site conceptual model. |
| Driving Platform | CPT only | CPT only | The system can be used with a variety of direct push equipment. | The system can be used with a variety of direct push equipment. | The system can be used with a variety of direct push equipment. | The system can be used with a variety of direct push equipment. |
| Investigation Derived Waste | The system produces little to no investigation-derived waste. | The system produces little to no investigation-derived waste. | The system produces little to no investigation-derived waste. | The system produces little to no investigation-derived waste. | The system produces little to no investigation-derived waste. | The system produces little to no investigation-derived waste. |
| Push Rate | Depending upon site geology, depth of probes, and general site layout, the system is capable of achieving 200 to 300 feet of pushes a day. | Depending upon site geology, depth of probes, and general site layout, the system is capable of achieving 200 to 300 feet of pushes a day. | Depending upon site geology, depth of probes, and general site layout, the system is capable of achieving 250 to 500 feet per day. | Depending upon site geology, depth of probes, and general site layout, the system is capable of achieving 250 to 500 feet per day. | Depending upon site geology, depth of probes, and general site layout, the system is capable of achieving 250 to 500 feet per day. | Depending upon site geology, depth of probes, and general site layout, the system is capable of achieving about 200 feet per day. |
| Real Time | Near-real-time data allow for a dynamic characterization that can lead to fewer mobilizations. | Near-real-time data allow for a dynamic characterization that can lead to fewer mobilizations. | Near-real-time data allow for a dynamic characterization that can lead to fewer mobilizations. | Near-real-time data allow for a dynamic characterization that can lead to fewer mobilizations. | Near-real-time data allow for a dynamic characterization that can lead to fewer mobilizations. | Near-real-time data allow for a dynamic characterization that can lead to fewer mobilizations. |
| Spatial Resolution | The vertical spatial resolution is about 2.0 cm. | The vertical spatial resolution is about 2.0 cm. | The vertical spatial resolution is about 2.5 to 3.0 cm. | Continuous. | The vertical spatial resolution is about 2.5 to 3.0 cm. | The vertical spatial resolution is about 0.5 cm. |
| Training | While training is required, personnel need not be highly skilled to operate the system with a DP (non-CPT) platform. | While training is required, personnel need not be highly skilled to operate the system with a DP (non-CPT) platform. | While training is required, personnel need not be highly skilled to operate the system with a DP (non-CPT) platform. | While training is required, personnel need not be highly skilled to operate the system with a DP (non-CPT) platform. | ||
| Type of NAPL | The system readily detects most light to medium fuels and oils and can generally identify product type. | The system readily detects most light to medium fuels and oils and can generally identify product type. | The system readily detects most light to medium fuels and oils and can generally identify product type. | The system detects light to medium fuels and oils as well as monoaromatics and may be able to identify product type. | The system readily detects most light to medium fuels and oils and can generally identify product type. | The system readily detects most chlorinated NAPLs but generally cannot identify product type. |
| Limitations | ||||||
| Accessibility | Limited to areas where a 20-ton truck can gain access. | Limited to areas where a 20-ton truck can gain access. | ||||
| Aqueous Phase | The system does not detect aqueous-phase contamination. | The system does not detect aqueous-phase contamination. | The system does not detect aqueous-phase contamination. | The system does not detect aqueous-phase contamination. | The system does not detect aqueous-phase contamination. | The system does not detect aqueous-phase contamination. |
| Depth | Depending upon soils encountered can generally be pushed to 50 m. | Depending upon soils encountered can generally be pushed to 50 m. | Depending upon the DP rig used and the subsurface, material can be pushed up to 150 feet1. | Depending upon the DP rig used and the subsurface, material can be pushed up to 150 feet1. | Depending upon the DP rig used and the subsurface, material can be pushed up to 150 feet1. | Depending upon the DP rig used and the subsurface, material can be pushed up to 150 feet1. |
| Driving Platform | CPT only | CPT only | CPT and DP | CPT and DP | CPT and DP | CPT and DP |
| Quantitation | The system provides relative data rather than quantitative data. | The system provides relative data rather than quantitative data. | The system provides relative data rather than quantitative data. | The system provides relative data rather than quantitative data. | The system provides relative data rather than quantitative data. | The system provides relative data rather than quantitative data. |
| Training | The operation of the ROST™/CPT requires considerable experience. | The operation of the SCAPS requires considerable experience. | If used with a CPT rig the operation requires considerable experience. | If used with a CPT rig the operation requires considerable experience. | If used with a CPT rig the operation requires considerable experience. | If used with a CPT rig the operation requires considerable experience. |
| Type of NAPL | The system does not readily identify coal tars, creosote, or bunker oil, nor does it detect monoaromatics or chlorinated aliphatics. | The system does not readily identify coal tars, creosote, or bunker oil, nor does it detect monoaromatics or chlorinated aliphatics. | The system does not detect light fuels and oils or chlorinated aliphatics. | The system does not readily identify coal tars, creosote, or bunker oil, nor does it detect chlorinated aliphatics. | The system does not readily identify coal tars, creosote, or bunker oil, nor does it detect monoaromatics or chlorinated aliphatics. | The system identifies chlorinated aliphatics. |
1 Some DP rigs are capable of depths greater than 250 feet (Telephone contact with Geoprobe). Dakota Technologies suggests 150 feet as a reasonable maximum depth for the LIF probe.
Performance Specification
Interferences
The in situ fluorescence response of the LIF sensors to hydrocarbon compounds is sensitive to interferences of which variations in the soil matrix are the most pronounced. LIF sensitivity to petroleum hydrocarbons in soil has been shown to be inversely proportional to the available surface area of the soils. Sandy soils tend to have a much lower total available surface area than clay soils, so hydrocarbon compounds in sandy soils generally yield a higher fluorescence response than they do in clay-rich soils.
For systems using ultraviolet light to test for materials containing high levels of PAHs, the light is absorbed by smaller PAHs, and this energy may be transferred to heavier PAHs before fluorescence can occur. The continued cascading of this absorbed light up the PAH size chain may eventually result in the larger PAHs emitting redder light. This will distort the interpretation of both what types of contaminants are present and their concentrations. At some point this energy transfer system may express itself as thermal energy rather than fluorescence (Martin and St. Germain 2008).
Although intended specifically to target petroleum hydrocarbons, the excitation energy produced by a LIF system's lasers can cause other substances to fluoresce as well, which can cause interference problems.
The presence of the following materials can cause false positives [weak 1-3% RE value), medium 3-10% RE, strong >10% RE] (St. Germain 2008):
- sea shells (weak-medium)
- paper(medium-strong)
- peat/meadow mat(weak)
- calcite/calcareous sands (weak-medium)
- asphalt (very weak)
- stiff/viscous tars (weak)
- certain soils (weak)
- tree roots (weak-medium)
- sewer lines (medium-strong)
- coal (very weak to none)
- quicklime (weak)
Other man-made non-hydrocarbon fluorescing materials that might be found in the subsurface environment include deicing agents, antifreeze additives, and some detergent products. In many cases it is possible for an experienced operator to differentiate between the fluorescent signatures of hydrocarbons and other interfering compounds.
Both the TarGOST® system for coal tars and creosote and the DyeLIF™ system for chlorinated aliphatic organics use a non-negative least squares fitting software that eliminates most interferences.
Detection Limits
LIF data quality is sufficient for qualitative screening, and relative intensities may be considered quantitative screening level data only. Site-specific detection limits vary from levels of 10 to 1,000 mg/kg, but exact detection limits are difficult to determine and will vary between sites (soil types) and petroleum products.
The response is generally monotonic (linear). There may be some nonlinearity at high concentration with heavier oils. In sandy soils, nonlinearity occurs at lower concentrations than in clay-rich soils.
Quality Control
The SCAPS LIF sensor's response is checked using a quinine sulfate fluorescent standard before and after each push. This measurement is a check of system performance and provides a means for normalizing measurements. If the fluorescent intensity changes by more than 20 percent of the initial value determined during pre-push calibration, system troubleshooting procedures are initiated (EPA 1995).
The RE is used for quality control for DyeLIF™, TarGOST®, UVOST, and ROST™. The RE is similar to a calibration gas used in a flame ionization or photoionization detector and is placed on the sapphire probe window before each push. This measurement is a check of system performance and provides a means for normalizing measurements.
For all systems, a clean sand blank can be measured pre- and post-push as part of the standard data collection procedure. The blank helps assure that the sapphire window does not become contaminated and that the sensor does not develop a "memory effect" from previous samples. If the clean sand blank LIF measurement varies beyond 50 percent of its pre-push calibration value, troubleshooting procedures must be initiated.
Because of heterogeneity issues, direct comparison of a LIF log with a nearby soil grab sample taken at the same depth may not provide useful information.
References
![]() Direct Push Site Characterization of NAPL with Laser-Induced Fluorescence (LIF)
Direct Push Site Characterization of NAPL with Laser-Induced Fluorescence (LIF)
Martin, Travis and Randy St. Germain.
2008 North American Environmental Field Conference & Exposition January 16, 2008 Tampa, FL.
![]() Dye Based Laser-Induced Fluorescence Sensing of Chlorinated Solvent DNAPLs
Dye Based Laser-Induced Fluorescence Sensing of Chlorinated Solvent DNAPLs
St. Germain, R., M. Einarson, A. Fure, S. Chapman, and B. Parker.
3rd International Symposium on Cone Penetration Testing, May 12-14, 2014, Las Vegas, Nevada
![]() New Generation Optical Sensors for Characterizing NAPL Source Zones
New Generation Optical Sensors for Characterizing NAPL Source Zones
St. Germain, R.
Remediation Technology Symposium, May 14-15, 2008, Sacramento, CA, 34 slides, 2008.
![]() Site Characterization Analysis Penetrometer System (SCAPS) Innovative Technology Evaluation Report
Site Characterization Analysis Penetrometer System (SCAPS) Innovative Technology Evaluation Report
EPA 540-R-95-520, 68 pp, 1995.
